Updated 23 June 2026 — this post has been rebuilt on the June 2026 dataset snapshot (1,511 active TLDs, 3,183,285,503 observed hostnames) and triangulated against our 9 June 2026 typed-DNS crawl. The original March 2026 edition predated both our data-journalism format standard and our first-party DNS resolution data. This revision adds a full Methodology section, replaces loose "domain" counts with deduplicated observed-hostname counts, adds an A-record resolution pass that tests how much of each TLD is actually live, and corrects the namespace tables. Where the numbers moved, the Methodology explains why.
The Internet runs on a naming system most people never think about — until something breaks.
Behind every website, every email, every API call is a top-level domain. There are 1,511 active TLDs in our June 2026 snapshot, ranging from the ubiquitous .com to obscure country-code extensions like .ax (Åland Islands) and new gTLDs like .motorcycles. ICANN has delegated over 1,800 TLD strings since the namespace expansion began in 2012, but not all survive. Dozens have been revoked, withdrawn, or never activated, and many that remain in the root zone carry almost no traffic.
The conventional wisdom is simple: .com dominates, ccTLDs serve their countries, and new gTLDs are a rounding error. The data both confirms and complicates that story. Concentration is even more extreme than the headline suggests — but it is concentrated in different places than registry marketing implies, and a large share of the long tail does not resolve at all.
We analyzed 3,183,285,503 observed hostnames across 1,511 TLDs using the DomainsProject dataset — the world's largest continuously maintained Internet domains collection. We categorized every TLD by type, measured concentration, computed registration density per capita, and then ran a full A-record resolution pass against our June 2026 DNS crawl to separate names that merely exist in the namespace from names that actually answer.
The headline: three TLDs account for 59% of all observed hostnames. The top 10 account for 71%, and the top 50 account for 90%. The remaining 1,461 TLDs share what is left — and 804 of them hold fewer than 10,000 hostnames each. The namespace is wide but shallow.
The Data
DomainsProject continuously crawls and indexes hostnames across every delegated TLD in the IANA root zone. Our June 2026 snapshot covers:
| Category | Count | Coverage |
|---|---|---|
| Active TLDs tracked | 1,511 | IANA root zone (Russian-administered TLDs excluded) |
| Total observed hostnames | 3,183,285,503 | Largest public dataset |
| gTLDs (legacy + new) | 2.21B | 69.5% |
| Country-code TLDs (ccTLDs) | 969.8M | 30.5% |
| Legacy gTLDs (.com, .net, .org, .info) | 1.86B | 58.4% |
| New gTLDs (post-2012 round) | 318.2M | 10.0% |
Counts reflect unique observed hostnames — fully-qualified names (www.example.com, api.example.com, and the bare example.com) that appear in our crawl, deduplicated across the active dataset and its historical GitHub mirror. They are not registry registration totals, and they are not apex-only counts. We explain the distinction — and why it matters — in the Methodology.
Methodology
This post makes quantitative claims about concentration and adoption, so the definitions matter.
- Observed hostname (FQDN). The unit we count. A fully-qualified name we have seen in DNS —
example.com,www.example.com, andmail.example.comare three distinct hostnames under one registrable domain. This is why our per-TLD totals exceed registry registration counts: a single registered.dedomain can contribute dozens of observed hostnames. - Apex / registrable domain (eTLD+1). The registered root —
example.com,example.co.uk. We resolve the public suffix using the ICANN section of the Public Suffix List, so multi-label suffixes (.co.uk,.com.br) are handled correctly and a hosting platform's own subdomains are not miscounted as registry apexes. Apex counts are smaller than hostname counts; where a figure is apex-based (the .ai and .xyz companion studies, for example) we say so. - TLD classification. Each TLD is labeled legacy gTLD (the pre-2012 open generics — .com, .net, .org, .info), new gTLD (delegated in or after ICANN's 2012 application round — .xyz, .shop, .app, and ~1,200 others), or ccTLD (a two-letter ISO 3166-1 country code or its IDN equivalent). Restricted and sponsored pre-2012 strings (.edu, .gov, .biz, .pro, .mobi) are counted as gTLDs but excluded from the "new gTLD" tables.
- Resolution. Our 9 June 2026 A-record crawl records the hostnames that returned a positive answer (
NOERRORwith at least one IPv4 address). We compute each TLD's resolution rate as the share of its observed hostnames that appear in that positive set; a name absent from it — because it returnedNXDOMAIN/SERVFAIL/no answer, resolves only over IPv6, or was not reached — counts as non-resolving. The rate is therefore a conservative liveness floor, measured per observed hostname rather than per apex. - Russian-administered TLDs excluded. In keeping with project policy, the Russian-administered TLDs are excluded from the dataset and from every table and total here. The original edition of this post included one of them in its top 10; this revision does not, and all global-share percentages are computed over the excluded universe.
Dataset vs. registry counts. Our numbers diverge from registry marketing for three reasons: we count observed hostnames (which inflates relative to apex registrations), we count only names our crawl has actually seen (which deflates relative to zone-file totals that include never-used registrations), and we exclude Russian-administered TLDs. The net effect varies by TLD — a heavily-subdomained hosting ccTLD reads higher than its registration count, while a parked-heavy promotional gTLD reads lower. Treat these as a measure of the observed, functional namespace, not of registry revenue.
Known limitations. This is a single snapshot; it measures presence and resolution, not query volume or uptime. Hostname-weighted counting gives equal weight to a one-page site and a thousand-subdomain platform, which is the opposite bias from traffic-weighted surveys. DNS visibility varies by region and by how aggressively a domain firewalls automated resolvers. The full per-TLD breakdown is reproducible from the TLD statistics dashboard and the dataset.
The Scorecard: TLD Concentration
Top 10 TLDs by Observed Hostnames
| Rank | TLD | Type | Hostnames | Global Share |
|---|---|---|---|---|
| 1 | .com | Legacy gTLD | 1.36B | 42.7% |
| 2 | .net | Legacy gTLD | 400.8M | 12.6% |
| 3 | .de | ccTLD | 117.7M | 3.7% |
| 4 | .org | Legacy gTLD | 74.4M | 2.3% |
| 5 | .jp | ccTLD | 73.4M | 2.3% |
| 6 | .cn | ccTLD | 52.2M | 1.6% |
| 7 | .xyz | New gTLD | 50.6M | 1.6% |
| 8 | .br | ccTLD | 50.3M | 1.6% |
| 9 | .uk | ccTLD | 43.8M | 1.4% |
| 10 | .fr | ccTLD | 43.1M | 1.4% |
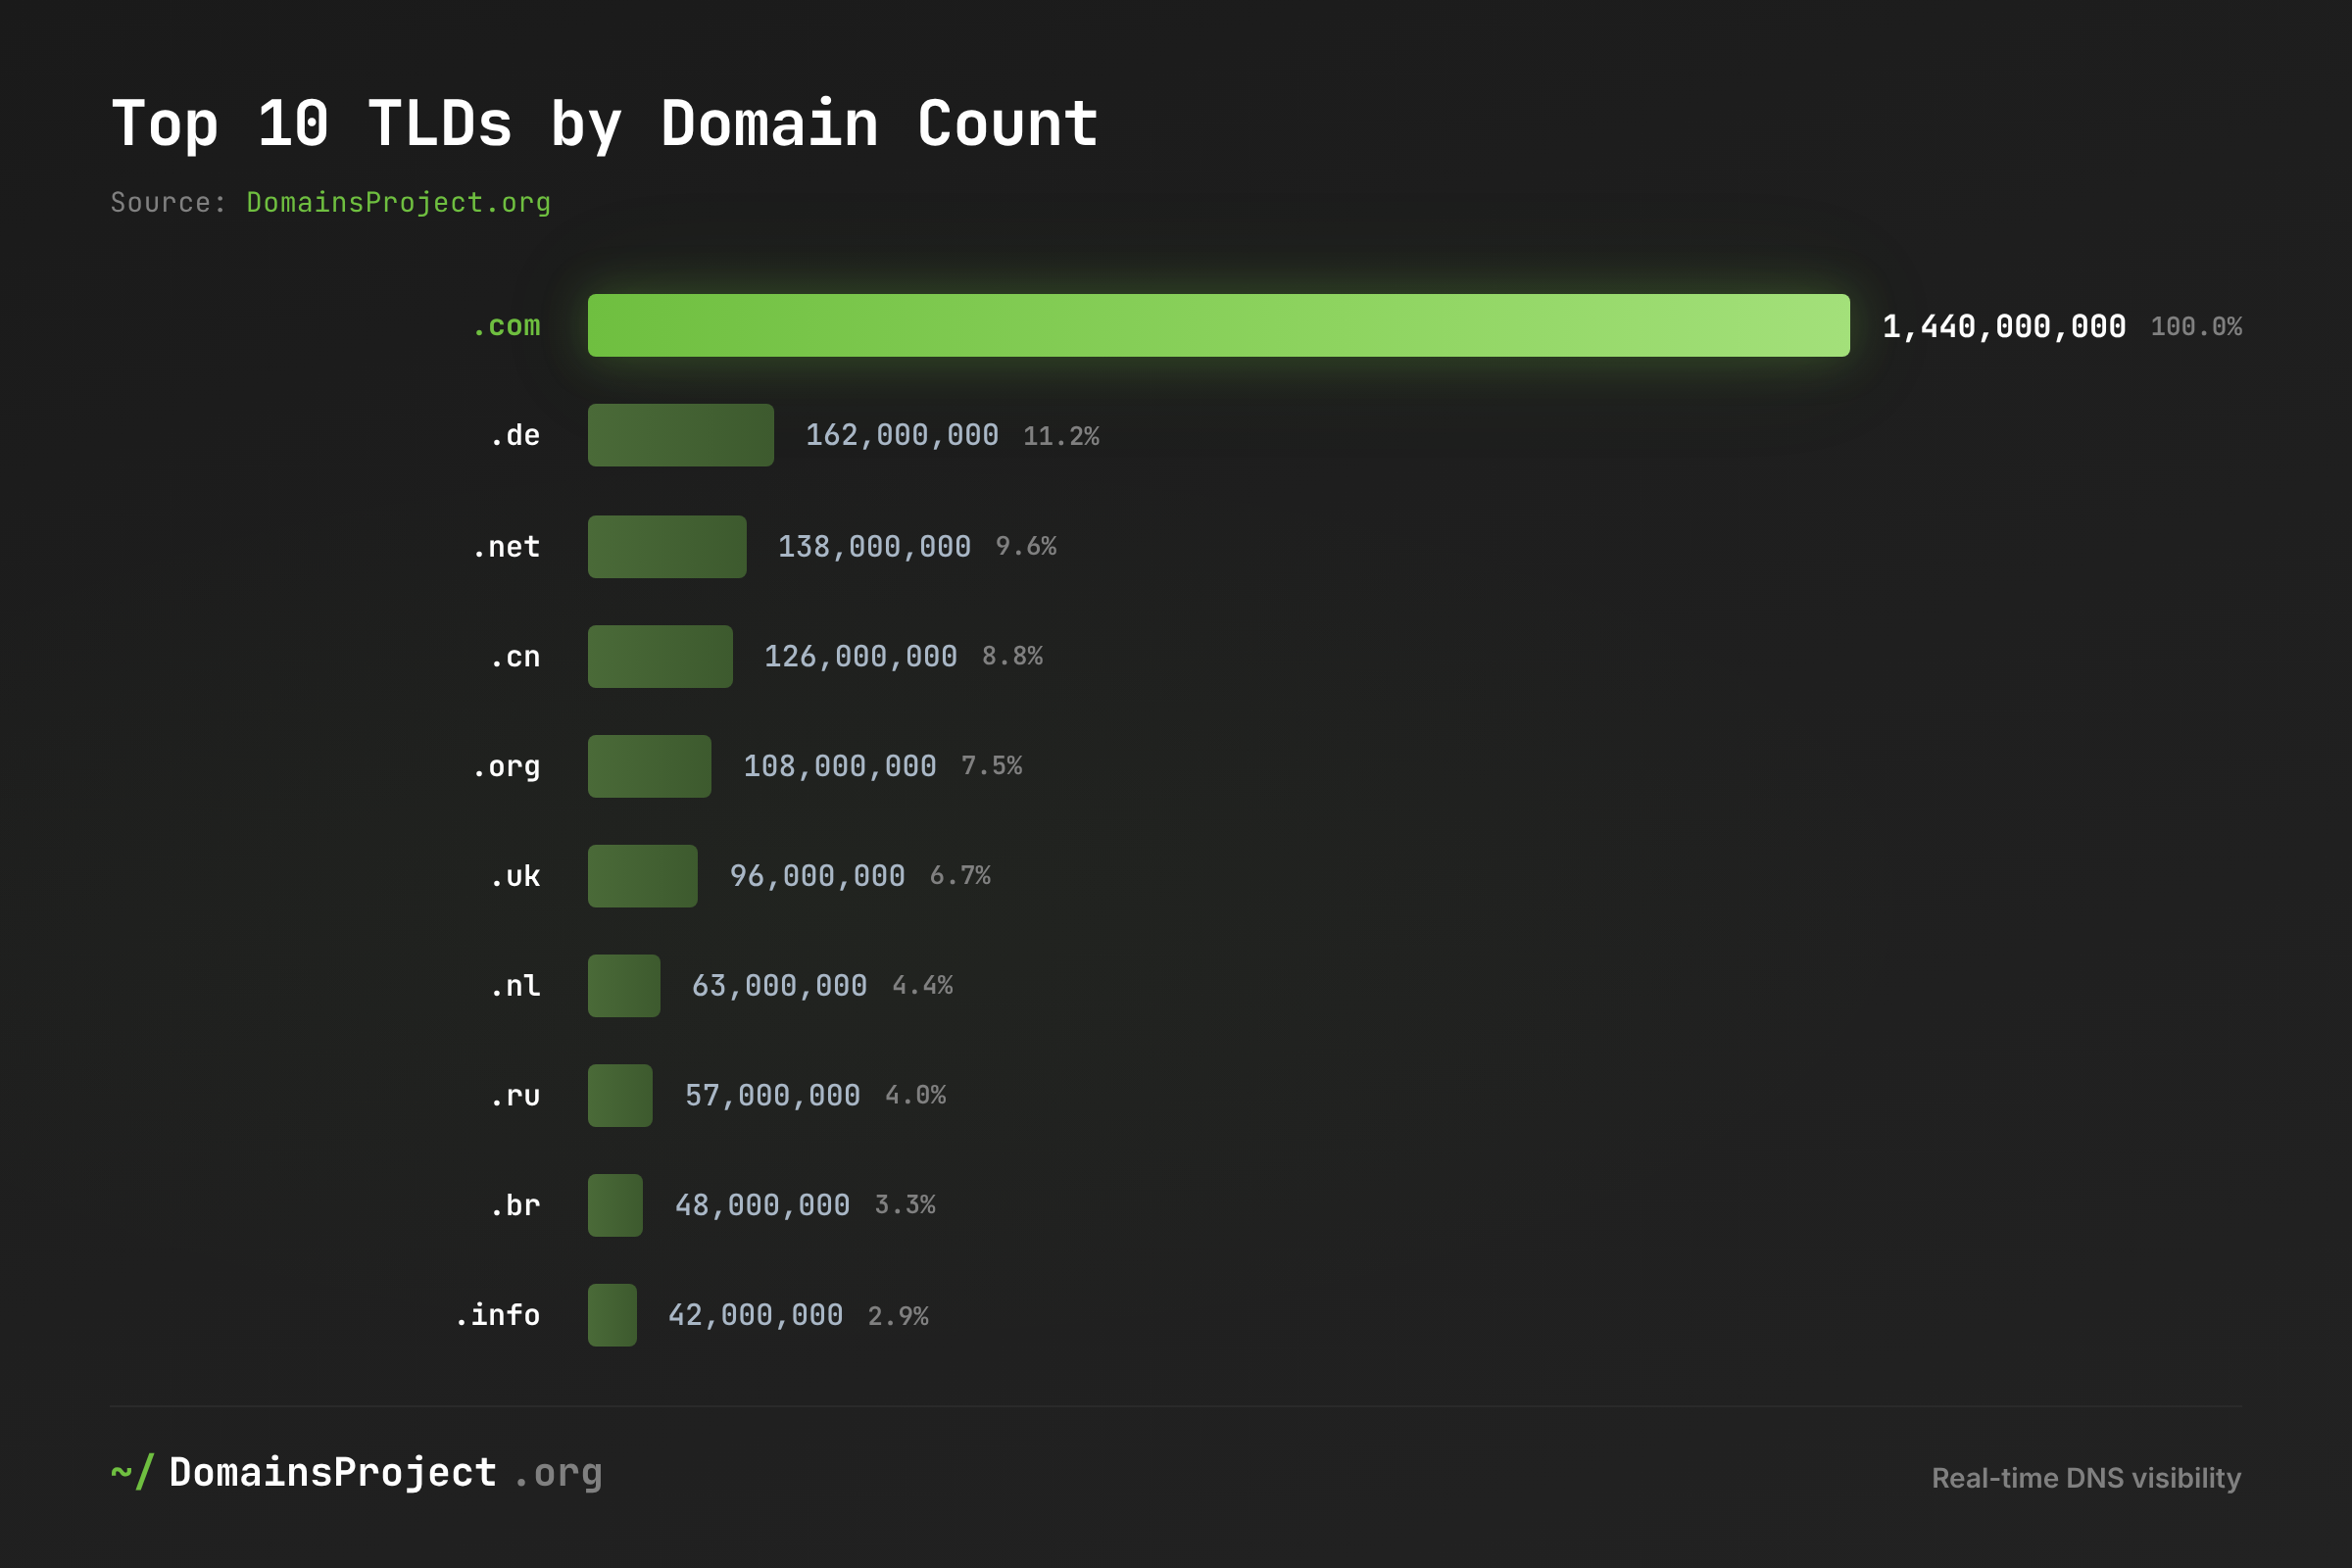
.com alone holds 42.7% of all observed hostnames — over four in ten names on the functional Internet resolve under a single TLD managed by Verisign. This isn't just market dominance; it's a concentration risk. A sustained .com registry outage would affect more hostnames than the next twenty TLDs combined.
.net is the surprise of the table at 400.8 million hostnames — second only to .com. This is a hostname-counting artifact worth naming explicitly: .net is the default zone for an enormous amount of infrastructure (CDNs, dynamic-DNS providers, mail and hosting back-ends), so it accumulates subdomains far faster than it accumulates registrations. By apex count .net is a distant also-ran; by observed-hostname count it is the Internet's second namespace. The gap between those two readings is the single best illustration of why counting methodology matters.
The remaining top 10 is a row of ccTLDs — .de, .jp, .cn, .br, .uk, .fr — punctuated by one new gTLD, .xyz, the only post-2012 extension to reach this altitude. After .com and .net, no single TLD holds more than 3.7% of the namespace.
Concentration Metrics
| Metric | Value |
|---|---|
| Top 1 TLD share (.com) | 42.7% |
| Top 3 TLD share (.com, .net, .de) | 59.0% |
| Top 10 TLD share | 71.2% |
| Top 50 TLD share | 90.3% |
| TLDs with >1M hostnames | 121 |
| TLDs with <10K hostnames | 804 |
| TLDs with <1K hostnames | 648 |
804 TLDs — more than half the namespace — have fewer than 10,000 hostnames each, and 648 have fewer than 1,000. Many are new gTLDs that never gained traction (.hair, .motorcycles, .fishing) or ccTLDs for small territories (.ax, .bv, .sj). ICANN approved hundreds of new strings; registrants overwhelmingly chose the incumbents. The namespace is wide but shallow — the top 50 TLDs cover 90% of everything, and the bottom 1,000 collectively account for less than 3%.
Legacy gTLDs: The Incumbents Hold Firm
The four legacy gTLDs — .com, .net, .org, and .info — predate the modern expansion and together account for 58.4% of all observed hostnames. Their dominance is structural, not accidental.
Legacy gTLD Breakdown
| TLD | Hostnames | Global Share | Year Delegated | Registry |
|---|---|---|---|---|
| .com | 1.36B | 42.7% | 1985 | Verisign |
| .net | 400.8M | 12.6% | 1985 | Verisign |
| .org | 74.4M | 2.3% | 1985 | Public Interest Registry |
| .info | 24.1M | 0.8% | 2001 | Identity Digital |
.com's dominance is self-reinforcing. Users assume websites end in .com. Browsers auto-complete .com. Email systems default to .com. This creates a network effect that no marketing budget for .xyz or .online has overcome. The 2012 gTLD expansion was supposed to break this lock-in — fourteen years later, .com's share of observed hostnames has barely moved.
.net's 400.8 million hostnames understate how few .net domains are actually registered and overstate how many distinct organizations use it. Verisign reports on the order of 13 million .net registrations; the gap is subdomains. Much of .net's hostname mass comes from provider infrastructure — CDN edge nodes, dynamic-DNS hostnames, and mail gateways that mint subdomains by the thousand. It is consistent with the data to read .net less as a destination namespace and more as the Internet's plumbing.
.org at 74.4 million is the nonprofit and open-source namespace, but increasingly hosts commercial sites as well. The controversial 2019 attempt to sell the .org registry to a private equity firm highlighted the governance risks of TLD concentration.
.info at 24.1 million has struggled with a reputation for spam and abuse. Its low registration cost attracts bulk registrations that inflate hostname counts relative to legitimate use — a pattern we test directly in the resolution section below.
Country-Code TLDs: A Fractured Landscape
The ccTLDs in our dataset represent the countries and territories with an ISO 3166-1 delegation (Russian-administered codes excluded). Together they hold 969.8 million hostnames (30.5%), but the distribution is wildly uneven.
Top ccTLDs by Observed Hostnames
| Rank | TLD | Country | Hostnames | Share of ccTLDs | Global Share |
|---|---|---|---|---|---|
| 1 | .de | Germany | 117.7M | 12.1% | 3.7% |
| 2 | .jp | Japan | 73.4M | 7.6% | 2.3% |
| 3 | .cn | China | 52.2M | 5.4% | 1.6% |
| 4 | .br | Brazil | 50.3M | 5.2% | 1.6% |
| 5 | .uk | United Kingdom | 43.8M | 4.5% | 1.4% |
| 6 | .fr | France | 43.1M | 4.4% | 1.4% |
| 7 | .nl | Netherlands | 36.3M | 3.7% | 1.1% |
| 8 | .it | Italy | 33.1M | 3.4% | 1.0% |
| 9 | .au | Australia | 32.2M | 3.3% | 1.0% |
| 10 | .pl | Poland | 29.3M | 3.0% | 0.9% |
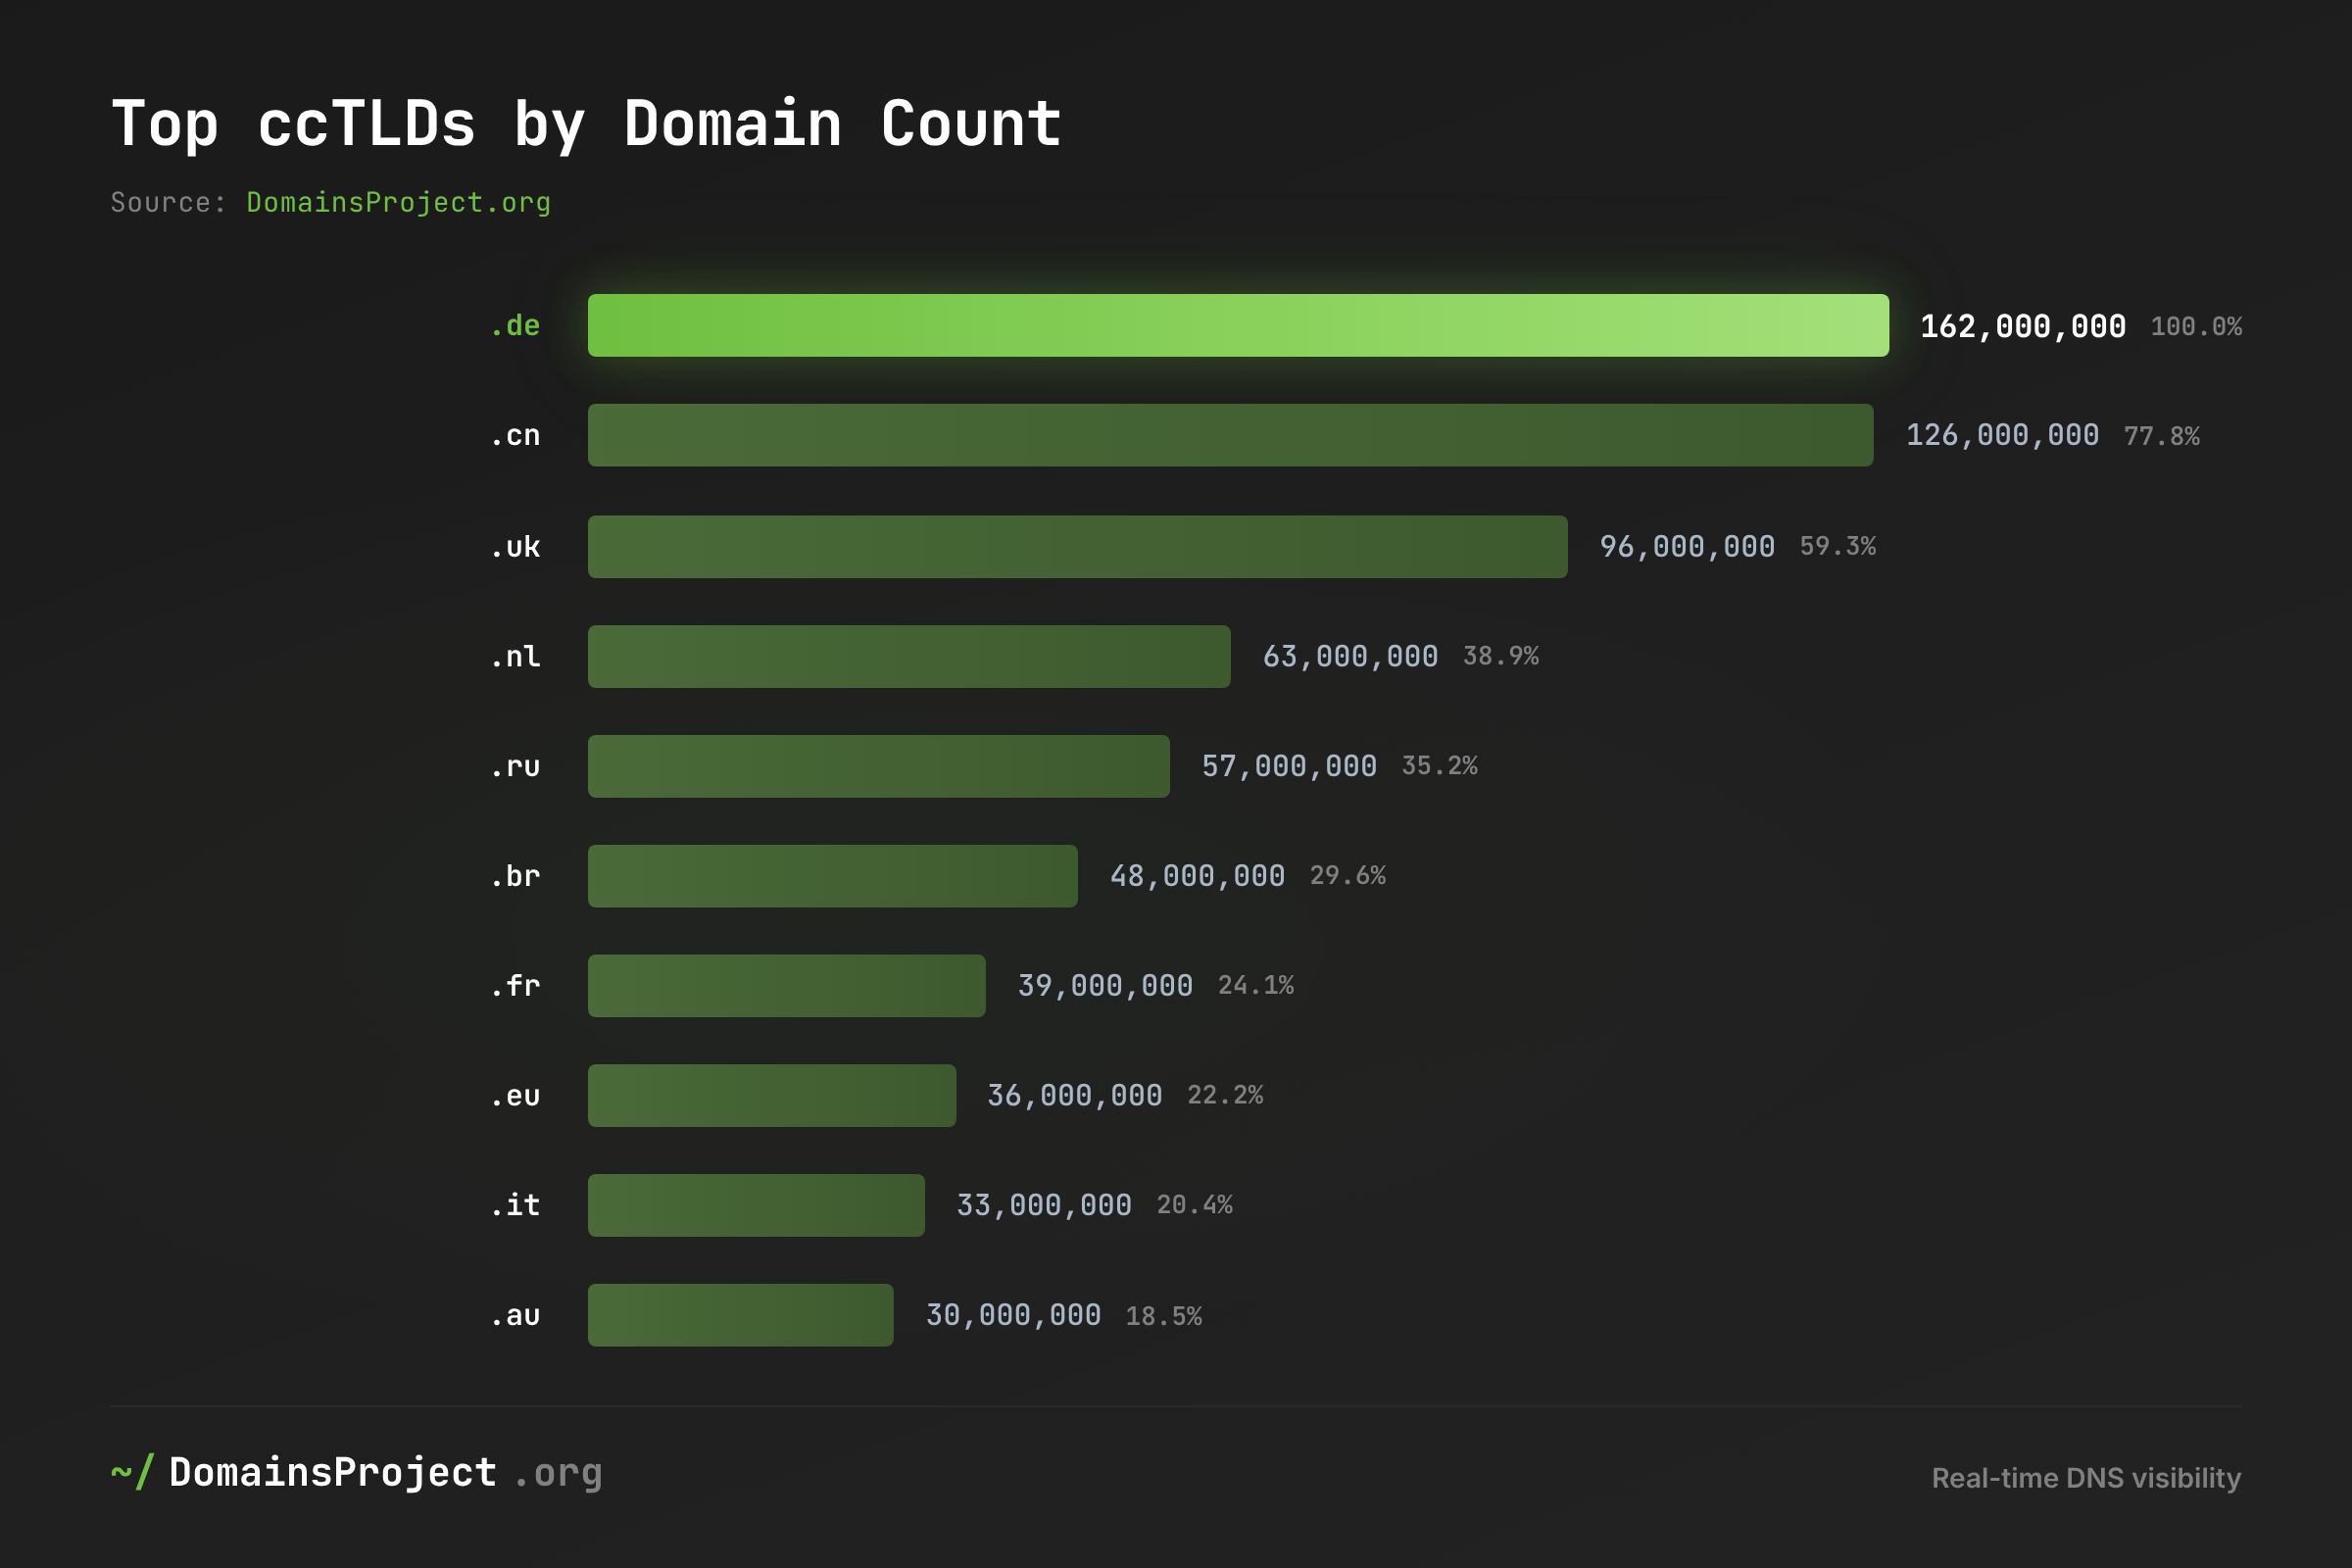
.de is the world's largest ccTLD at 117.7 million hostnames — larger than .org. Germany's strong domestic Internet economy, combined with DENIC's reputation for reliable registry operations, makes .de the default for German businesses. Notably, .de registration doesn't require German residency, making it accessible internationally.
.jp at 73.4 million is the second-largest ccTLD — a striking result given Japan's smaller registration base, and another hostname-counting signal: Japanese hosting and corporate infrastructure generate deep subdomain trees. .cn at 52.2 million reflects China's parallel Internet ecosystem, where ICP licensing requirements both limit and funnel registrations.
The long tail of ccTLDs is nearly empty. Territories like .bv (Bouvet Island, uninhabited), .gs (South Georgia), and .sj (Svalbard) exist in the root zone with negligible registrations. The bottom 150 ccTLDs together hold fewer hostnames than .nl alone.
ccTLD Registration Density
Raw counts favor large countries. Normalizing by population reveals where the Internet is dense rather than merely big — observed hostnames per capita:
| Country | ccTLD | Hostnames | Population | Hostnames per Capita |
|---|---|---|---|---|
| Netherlands | .nl | 36.3M | 17.9M | 2.03 |
| Switzerland | .ch | 17.8M | 8.9M | 2.00 |
| Sweden | .se | 15.5M | 10.6M | 1.46 |
| Germany | .de | 117.7M | 84.5M | 1.39 |
| Denmark | .dk | 7.4M | 6.0M | 1.24 |
| Australia | .au | 32.2M | 26.6M | 1.21 |
| United Kingdom | .uk | 43.8M | 68.4M | 0.64 |
| Brazil | .br | 50.3M | 212M | 0.24 |
| India | .in | 22.6M | 1.45B | 0.016 |
The Netherlands and Switzerland lead at roughly two observed hostnames per capita — the densest national namespaces among major economies. Both punch far above their population weight, consistent with their roles as European hosting and financial-infrastructure hubs rather than with their domestic market size.
India sits at 0.016 hostnames per capita — a hundred-fold gap below the leaders. With 1.45 billion people and only 22.6 million .in hostnames, India's Internet presence runs overwhelmingly on .com and other global TLDs. This is not a registration failure so much as a structural preference for global namespaces in an English-dominant, export-oriented tech sector (a pattern we examine in our .in companion study).
New gTLDs: The Expansion That Didn't Expand
ICANN's 2012 new gTLD program was supposed to transform the namespace. Over 1,200 new TLD strings were approved — .app, .blog, .shop, .xyz, .online, and hundreds more. Fourteen years later, the entire post-2012 cohort holds just 10.0% of observed hostnames (318.2 million) — and a handful of strings account for most of that.
Top New gTLDs by Observed Hostnames
| Rank | TLD | Hostnames | Share of New gTLDs | Year Delegated |
|---|---|---|---|---|
| 1 | .xyz | 50.6M | 15.9% | 2014 |
| 2 | .top | 29.3M | 9.2% | 2014 |
| 3 | .shop | 23.5M | 7.4% | 2016 |
| 4 | .online | 22.5M | 7.1% | 2015 |
| 5 | .site | 16.6M | 5.2% | 2015 |
| 6 | .store | 11.1M | 3.5% | 2016 |
| 7 | .blog | 8.1M | 2.5% | 2016 |
| 8 | .vip | 7.9M | 2.5% | 2017 |
| 9 | .bond | 7.8M | 2.4% | 2017 |
| 10 | .app | 6.7M | 2.1% | 2018 |
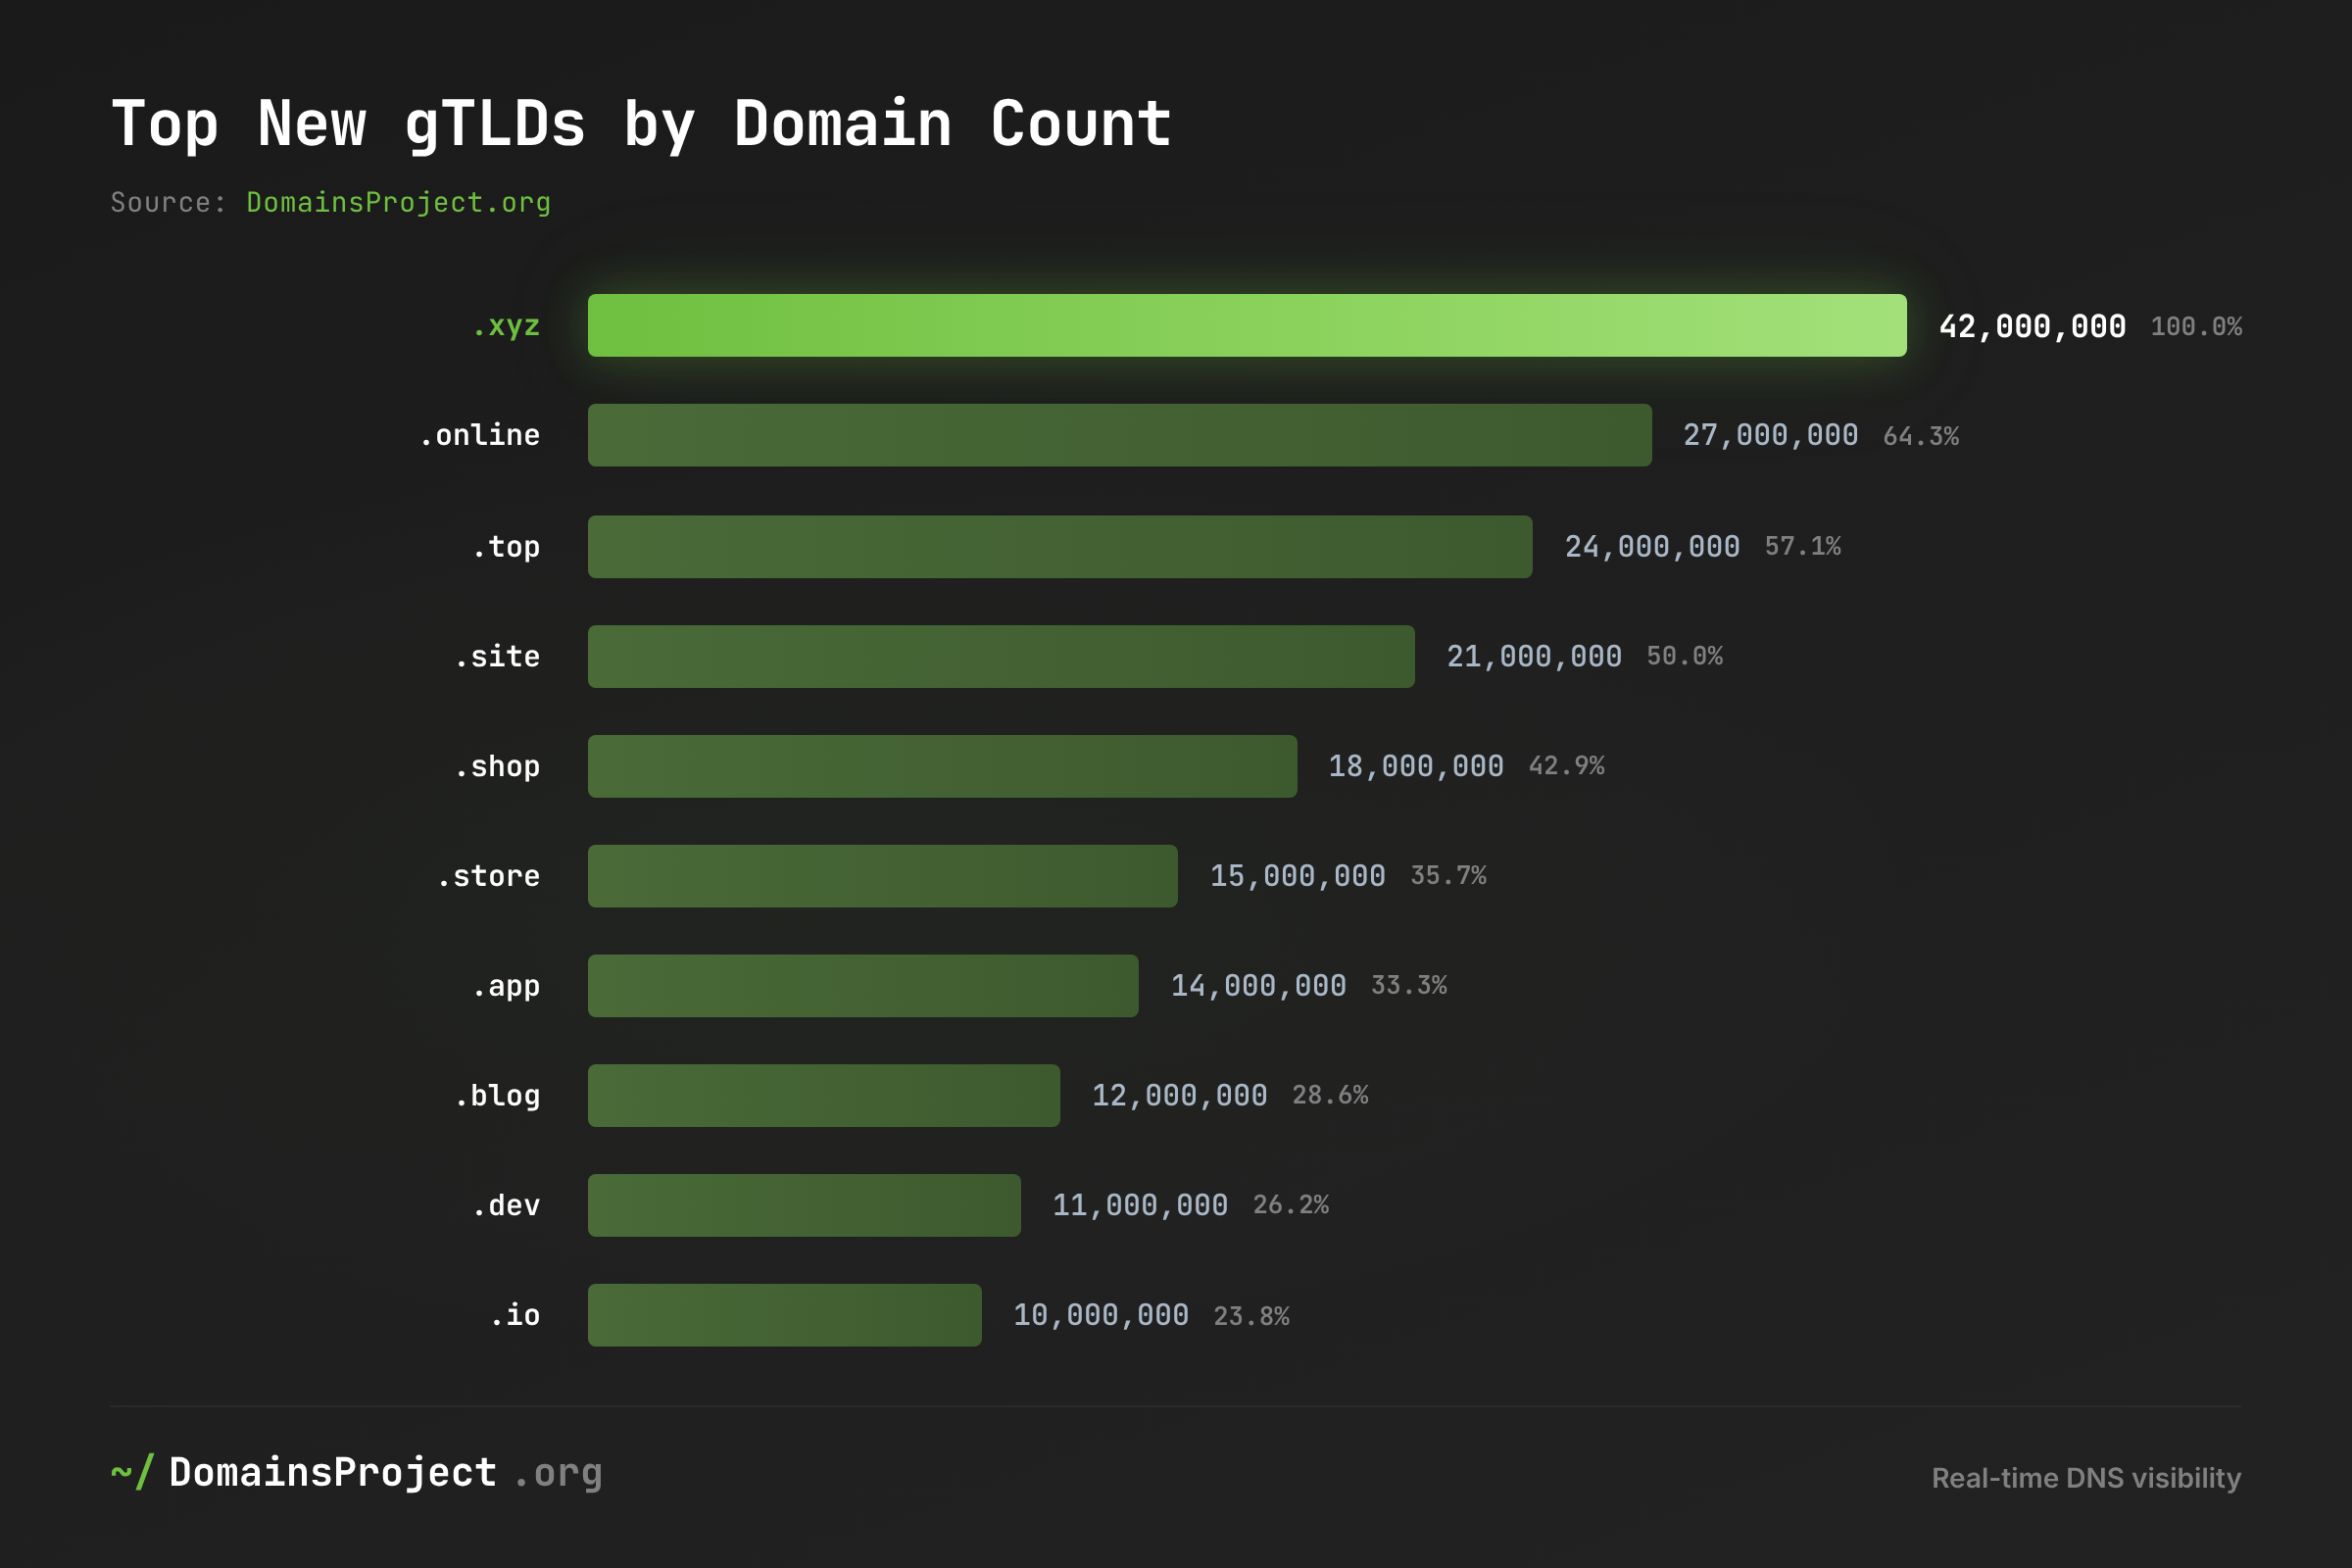
.xyz leads the new gTLDs at 50.6 million hostnames — 15.9% of the entire post-2012 cohort by itself — boosted by aggressive promotional pricing and Google's use of abc.xyz for Alphabet's corporate site. The top five strings account for 44.8% of all new gTLD hostnames; the other ~1,200 split the rest. (The full .xyz story is the subject of our companion analysis.)
The new gTLD program produced a handful of winners and a vast empty tail. ICANN charged $185,000 per application and collected over $350 million in fees on the promise of "competition and choice." A decade and a half later, .com's share of the functional namespace is essentially unchanged, and the median new gTLD holds fewer hostnames than a single popular .com subdomain tree.
New gTLD Adoption by Category
| Category | Example strings | Pattern |
|---|---|---|
| Generic | .xyz, .online, .site, .top | The volume leaders; cheap, neutral, promotional |
| Industry / commerce | .shop, .store, .app, .dev | Moderate adoption; .app/.dev benefit from enforced HTTPS |
| Geographic | .berlin, .tokyo, .nyc | Underperformed; niche civic use |
| Community | .club, .blog, .vip | Mixed; .club and .blog reach millions, most do not |
| Brand (.dotBrand) | .google, .amazon, .bmw | Hundreds of strings, near-zero public registration |
Brand TLDs are the quiet majority of strings and the quiet minority of usage. Companies maintain .google, .amazon, and .bmw for brand protection and internal use, not public registration; each averages a few thousand hostnames at most. Geographic TLDs underperformed expectations — .berlin, .tokyo, .paris and similar were supposed to create local digital identities, but most never achieved meaningful adoption outside niche civic and vanity use.
Does It Actually Resolve? The Functional Namespace
Existing in the namespace and answering in DNS are different things. To separate the two, we cross-referenced the observed-hostname inventory against our 9 June 2026 A-record crawl and measured, per TLD, what share of observed hostnames still return a live IPv4 address.
Across the whole namespace, 1.87 billion of 3.18 billion observed hostnames — 58.9% — returned a live A record. The other 41% are names we have seen that no longer answer: expired registrations, retired subdomains, and abandoned infrastructure. But the resolution rate is not uniform. It sorts the namespace cleanly by type.
| TLD | Type | Observed Hostnames | Live A Record | Resolution Rate |
|---|---|---|---|---|
| .it | ccTLD | 33.1M | 26.9M | 81.3% |
| .jp | ccTLD | 73.4M | 56.3M | 76.7% |
| .de | ccTLD | 117.7M | 88.5M | 75.2% |
| .net | Legacy gTLD | 400.8M | 291.1M | 72.6% |
| .nl | ccTLD | 36.3M | 26.0M | 71.7% |
| .fr | ccTLD | 43.1M | 29.5M | 68.5% |
| .com | Legacy gTLD | 1.36B | 777.9M | 57.2% |
| .org | Legacy gTLD | 74.4M | 41.4M | 55.7% |
| .cn | ccTLD | 52.2M | 25.6M | 49.0% |
| .info | Legacy gTLD | 24.1M | 10.7M | 44.4% |
| .xyz | New gTLD | 50.6M | 19.6M | 38.8% |
| .top | New gTLD | 29.3M | 10.9M | 37.3% |
| .online | New gTLD | 22.5M | 6.5M | 28.6% |
| .shop | New gTLD | 23.5M | 5.9M | 25.1% |
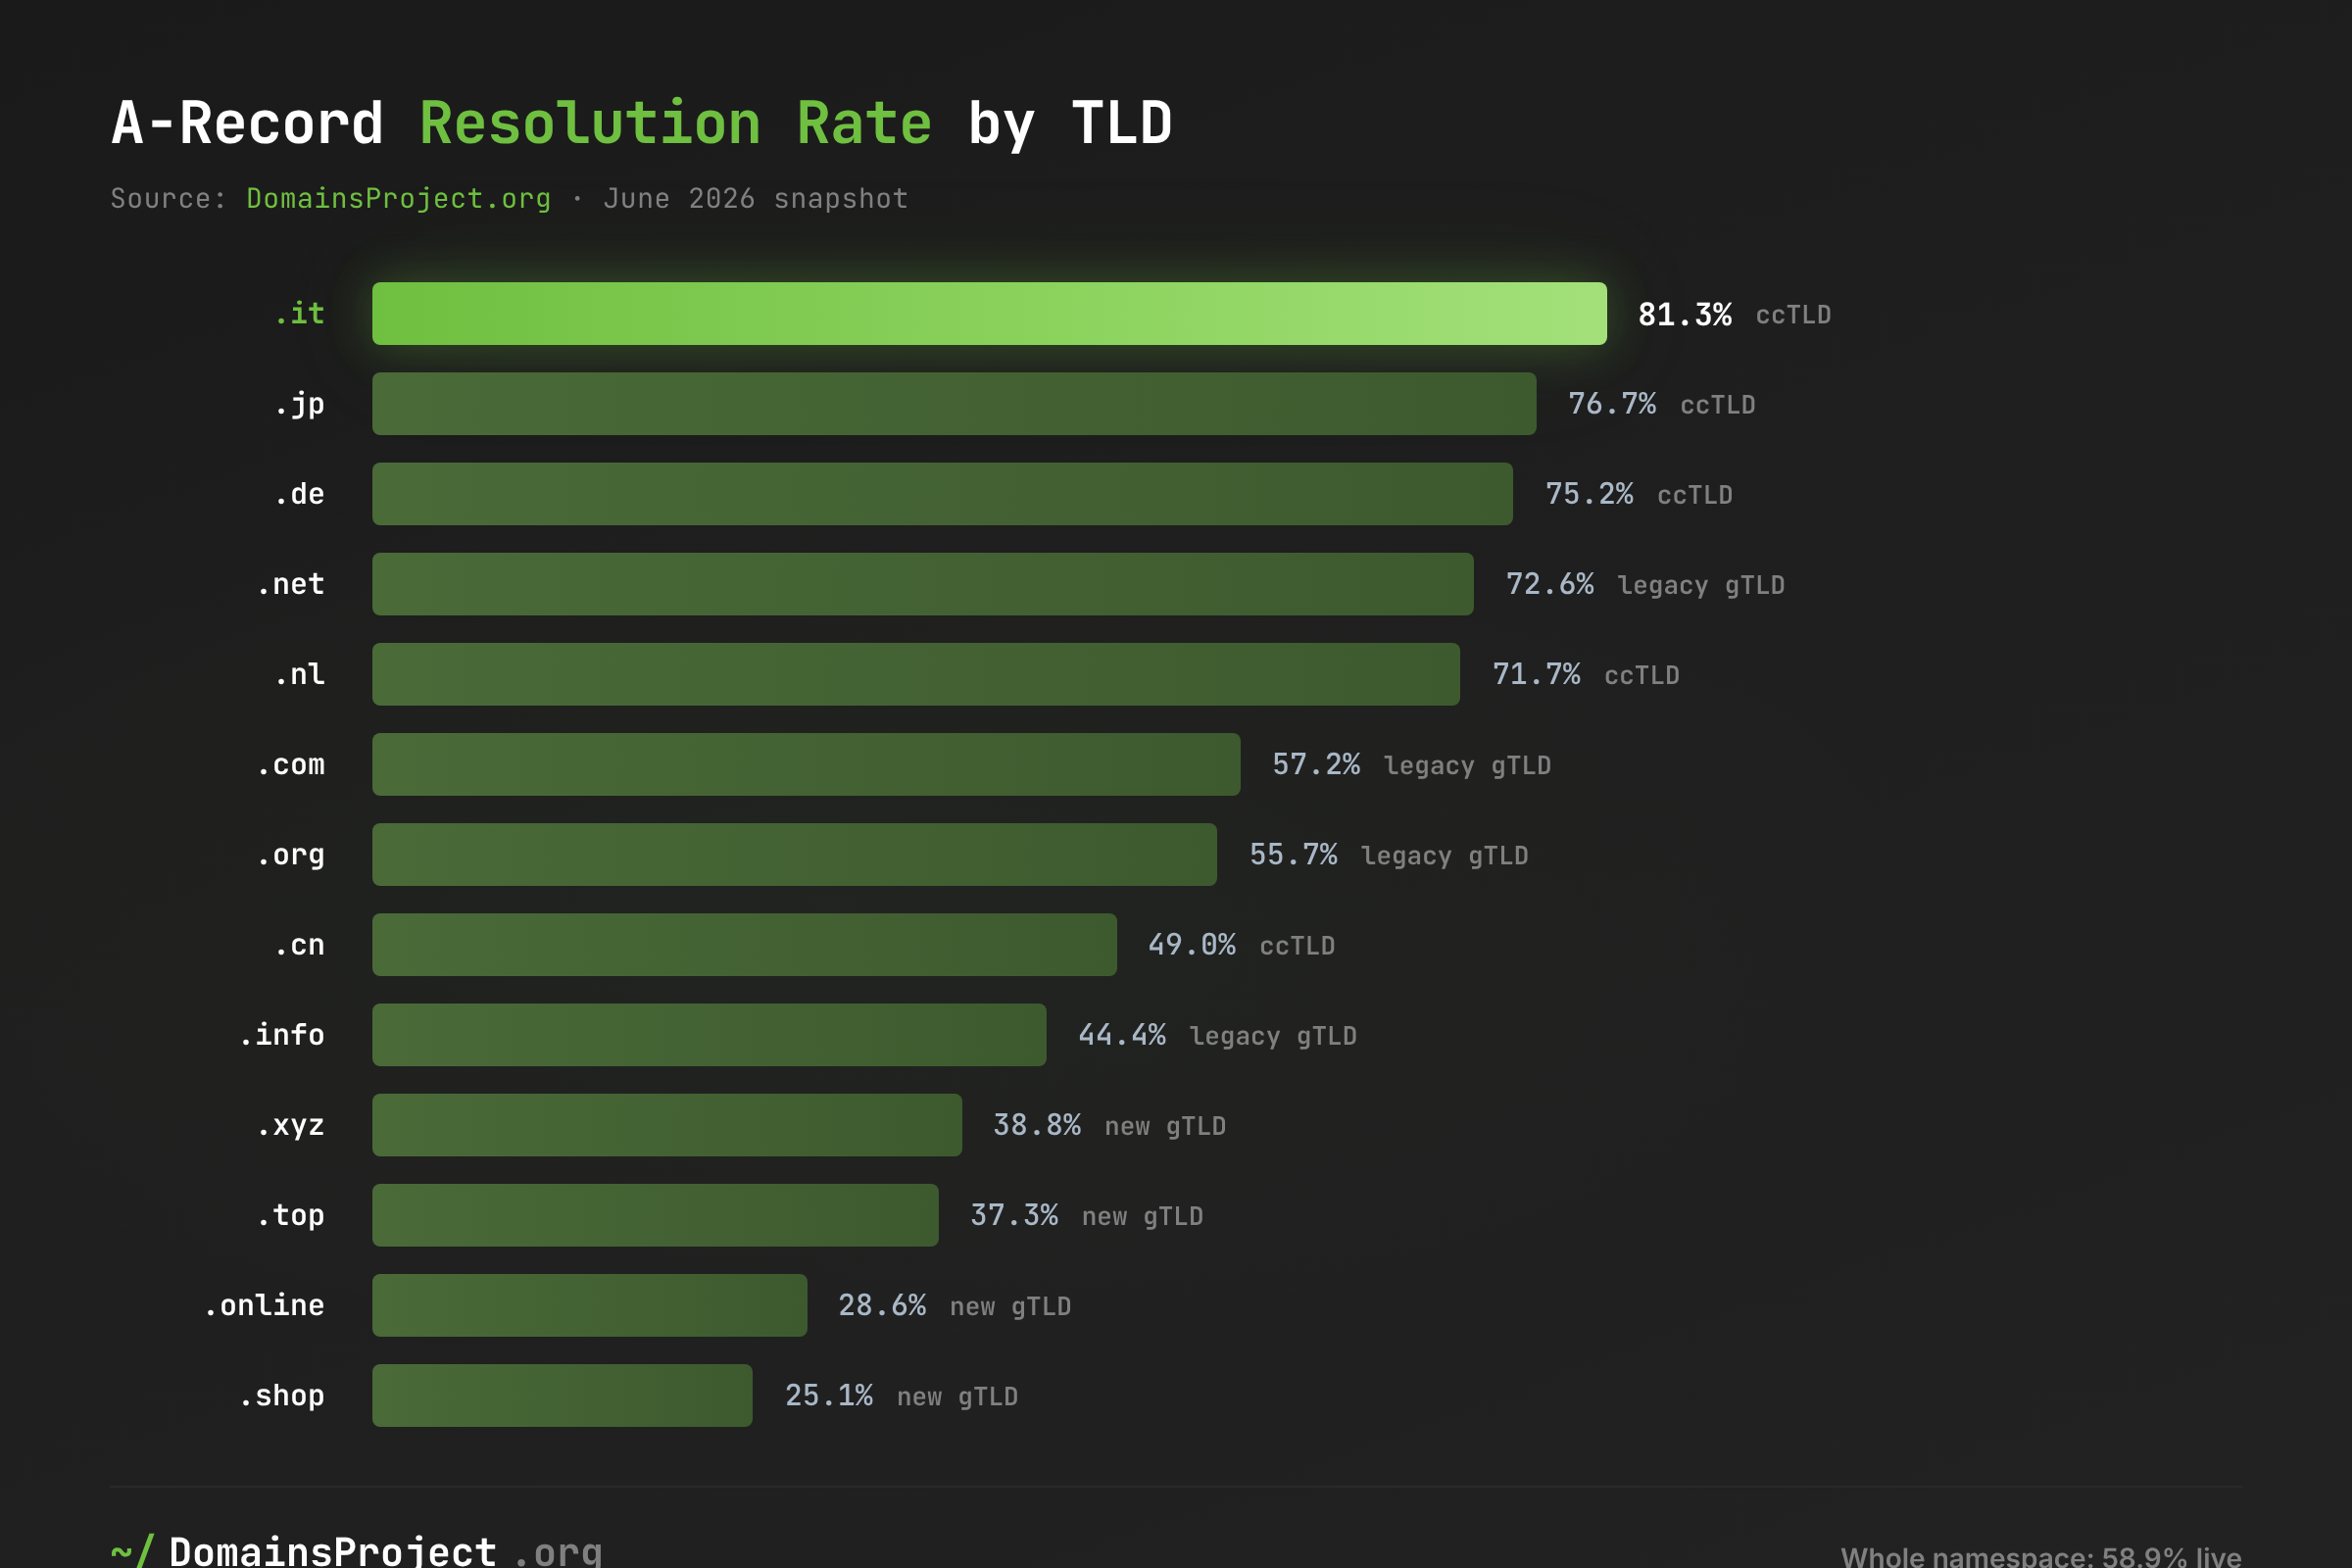
Country-code TLDs are the most live: .it, .jp, .de, and .nl all resolve above 70%. A registered ccTLD domain tends to be a domain someone is actually using — domestic businesses, institutions, and individuals with a reason to keep the lights on. .net is the standout among the generics at 72.6%, consistent with its role as infrastructure plumbing: provider subdomains exist precisely because they resolve to something.
The promotional new gTLDs sit at the bottom — .shop (25.1%), .online (28.6%), .top (37.3%), and .xyz (38.8%) all resolve below 40%. This is the clearest evidence in the dataset that registration counts overstate the functional new-gTLD namespace by roughly two-to-three times. A namespace built on $1 first-year pricing fills with names that are registered, observed once, and then never configured to point anywhere. .info, a legacy gTLD with a long-standing abuse reputation, resolves at just 44.4% — closer to the promotional gTLDs than to its legacy peers, quantifying the bulk-registration problem the section above described.
The caveats matter. A live A record means a name answers with an IPv4 address; it does not mean the name hosts a real, active website — an A record can point at a parking page, a redirect, or a holding server. Conversely, a name that resolves only over IPv6 (AAAA) would read as non-resolving here, mildly undercounting liveness. And the denominator includes the historical mirror, whose older names are likelier to have gone dark. Treat these rates as a directional measure of functional liveness, not a precise active-site census — but the gradient between ccTLDs and promotional gTLDs is far too large to be an artifact.
What's at Stake
The concentration data has concrete implications:
- Three TLDs (.com, .net, .de) account for 59% of all observed hostnames — a single-point-of-failure profile that the 2012 expansion was designed to dilute and did not. .com and .net alone, both run by Verisign, account for 55%.
- .com's 42.7% share means Verisign's operational and pricing decisions touch over four in ten names on the functional Internet — outsized leverage that no other registry approaches.
- 804 TLDs hold fewer than 10,000 hostnames — many are economically marginal and at risk of registry failure, which strands existing registrants and creates orphaned-namespace security gaps.
- New gTLD abuse is concentrated, not eliminated — the same low-cost strings that drive promotional volume (.top, .xyz, and parts of the long tail) recur in phishing and spam telemetry, dragging the reputation of the whole post-2012 cohort.
- ccTLD fragmentation creates blind spots — monitoring .com and .net covers 55% of observed hostnames, but the remaining 45% spans 1,509 TLDs with different registration policies, WHOIS availability, and abuse-response times.
- Per-capita gaps between the Netherlands (2.03 hostnames/person) and India (0.016) reflect structural digital divides that TLD policy alone cannot close.
What Would Help
The data points to specific actions for different audiences:
1. Security researchers: monitor the long tail, not just the giants. The top 50 TLDs cover 90% of hostnames, but abuse disproportionately originates from TLDs ranked below the top 20, where low cost and minimal verification meet weak registry response. Our per-TLD statistics pages provide the breakdowns to prioritize monitoring.
2. Domain investors: new gTLD adoption is real but brutally concentrated. Five strings hold 44.8% of all new gTLD hostnames; the other ~1,200 split the remainder. Investment theses should rest on demonstrated, resolving adoption — not registry-reported registration counts that include parked and never-used names.
3. Registries: resolution rates are a credibility metric. A TLD where most names never answer in DNS is a promotional-volume namespace, and browsers, mailbox providers, and reputation systems increasingly treat it as one. Publishing honest active-use figures would help the credible new gTLDs distinguish themselves from the churn.
4. ICANN: measure adoption by what resolves. Registry registration counts include parked, defensive, and bulk-registered names that never carry traffic. Resolution-based counting — as we use here — gives a far more accurate picture of the functional Internet than zone-file size.
5. Enterprise security teams: build TLD-aware threat models. A phishing domain on .com carries different base-rate signals than one on .top or a long-tail new gTLD. TLD reputation scoring — factoring abuse rates, verification requirements, registry responsiveness, and resolution rates — should inform email filtering, DNS policy, and threat-intel pipelines.
This analysis was conducted using the DomainsProject dataset, which continuously indexes hostnames across the active TLDs in the IANA root zone (Russian-administered TLDs excluded). Hostname counts reflect the June 2026 snapshot (1,511 TLDs, 3,183,285,503 observed hostnames); resolution figures reflect our 9 June 2026 A-record crawl. Explore the full breakdown on our TLD statistics dashboard or access the complete dataset for your own research.