Updated 23 June 2026 — rebuilt on the June 2026 dataset snapshot (1,511 active TLDs, 3,183,285,503 observed hostnames) and triangulated against our 9 June 2026 A-record crawl. The original March 2026 edition predated our data-journalism format standard and our first-party DNS resolution data. This revision adds a full Methodology section, replaces loose "domain" counts with deduplicated observed-hostname counts, and corrects the headline figure: .com now reads as 42.7% of observed hostnames, not the 44% the original reported. That move is mostly a recount on our new deduplication pipeline — not a claim that .com is shrinking over time — and the Methodology says so explicitly. This edition also adds an A-record pass showing only 57.2% of observed .com hostnames return a live address, and updates the runner-up table: by observed-hostname count, .net (400.8M) has surged into a clear second place.
On March 15, 1985, a Cambridge, Massachusetts company called Symbolics registered symbolics.com — the first .com domain name ever. By the end of 1987, only 100 .com domains existed. By 2000, there were 20 million. By 2012, 100 million. Today, .com accounts for 1.36 billion observed hostnames in our dataset — over four in ten names on the functional Internet — and a single company, Verisign, operates the entire thing with roughly 900 employees and a ~68% operating margin.
The Internet's namespace was never designed to be a monopoly. ICANN launched over 1,200 new top-level domains starting in 2012 to break .com's lock on the market. Fourteen years later, the entire post-2012 cohort of new gTLDs holds about 10% of all observed hostnames in our dataset. .com alone holds 42.7%.
We analyzed 3,183,285,503 observed hostnames across 1,511 active TLDs in the DomainsProject dataset — the world's largest continuously maintained Internet domains collection — cross-referenced the data with Verisign SEC filings, ICANN contract documents, NTIA regulatory records, and aftermarket sales data, and then ran a full A-record resolution pass to test how much of the .com namespace actually answers in DNS.
The headline: .com is not just the dominant TLD — it is the only infrastructure monopoly on the Internet with zero competitors, zero competitive bidding, and a government contract that auto-renews indefinitely. At 42.7% of observed hostnames it dwarfs everything else, yet our 9 June 2026 crawl finds only 57.2% of those hostnames return a live IPv4 address — even the giant carries a large dark fraction. Google was found guilty of Sherman Act violations for maintaining a 90% search market share. Verisign operates at 100% market share for .com, and the DOJ has acknowledged it "possesses significant market power" — but no antitrust action has ever been taken.
The Data
DomainsProject continuously crawls and indexes hostnames across every delegated TLD in the IANA root zone. Our June 2026 snapshot covers:
| Category | Count | Coverage |
|---|---|---|
| Active TLDs tracked | 1,511 | IANA root zone (Russian-administered TLDs excluded) |
| Total observed hostnames | 3,183,285,503 | Largest public dataset |
| .com observed hostnames | 1,360,818,815 | 42.7% of dataset |
| All other TLDs combined | 1.82B | 57.3% of dataset |
| Legacy gTLDs (.com, .net, .org, .info) | 1.86B | 58.4% |
Counts reflect unique observed hostnames — fully-qualified names (www.example.com, api.example.com, and the bare example.com) seen in our crawl, deduplicated across the active dataset and its historical GitHub mirror. They are not registry registration totals and they are not apex-only counts. Our 1.36 billion .com figure therefore exceeds Verisign's reported ~161 million registry registrations because a single registered domain contributes many observed hostnames. Both numbers tell the same story: .com is the backbone of the functional Internet — but as the Methodology and resolution section make clear, "functional" is doing real work in that sentence.
Methodology
This post makes quantitative claims about market concentration and pricing, so the definitions matter.
- Observed hostname (FQDN). Our base unit: a fully-qualified name seen in our crawl.
example.com,www.example.com, andmail.example.comare three hostnames under one registrable domain. The 1,360,818,815 figure is deduplicated observed hostnames — not registrations and not apexes. - Apex / registrable domain. The registered root (
example.com). Verisign's ~161M registry count is an apex-style figure; our hostname count runs an order of magnitude higher because of subdomains. Where this post cites a registration count (Verisign's base, new gTLD registrations, aftermarket sales), the figure comes from the cited registry or industry source, not from our crawl, and we label it as such. - Global share. Each TLD's observed hostnames divided by the 3,183,285,503-hostname total, computed over the dataset's universe with Russian-administered TLDs excluded. .com = 42.749%, reported here as 42.7%.
- Why the headline moved (48%→44%→42.7%). Earlier editions of our analysis reported .com near 44–48%. Most of the drop to 42.7% is a recount, not a real-world decline: the June 2026 snapshot runs on a rebuilt deduplication pipeline that merges the active dataset with its historical mirror and removes duplicate FQDNs that older counts double-counted, and it excludes Russian-administered TLDs from the denominator. We therefore present 42.7% as the current measured share on the new pipeline, not as evidence that .com is losing ground over time. A single snapshot cannot support a trend claim either way.
- Resolution. Our 9 June 2026 A-record crawl records hostnames that returned a positive answer (
NOERRORwith at least one IPv4 address). A TLD's resolution rate is the share of its observed hostnames in that positive set. A name absent from it —NXDOMAIN/SERVFAIL/no answer, IPv6-only, or not reached — counts as non-resolving. The rate is a conservative liveness floor, and a live A record can still point at a parking page, so treat it as a directional liveness proxy, not an active-site census. - Russian-administered TLDs excluded. In keeping with project policy, they are excluded from the dataset and from every table and total here.
Dataset vs. registry, and known limitations. Our 42.7% is a measure of the observed, functional namespace, not of registry revenue or query volume. Hostname-weighted counting gives equal weight to a one-page site and a thousand-subdomain platform — the opposite bias from traffic-weighted surveys. Financial, pricing, contract, and aftermarket figures below are third-party (Verisign SEC filings, the Domain Name Industry Brief, NTIA/ICANN documents, and aftermarket trackers) and are cited as such. The per-TLD breakdown is reproducible from the TLD statistics dashboard and the dataset.
The Scorecard: .com vs. Everything Else
Top 10 TLDs by Observed Hostnames
| Rank | TLD | Type | Hostnames | Share |
|---|---|---|---|---|
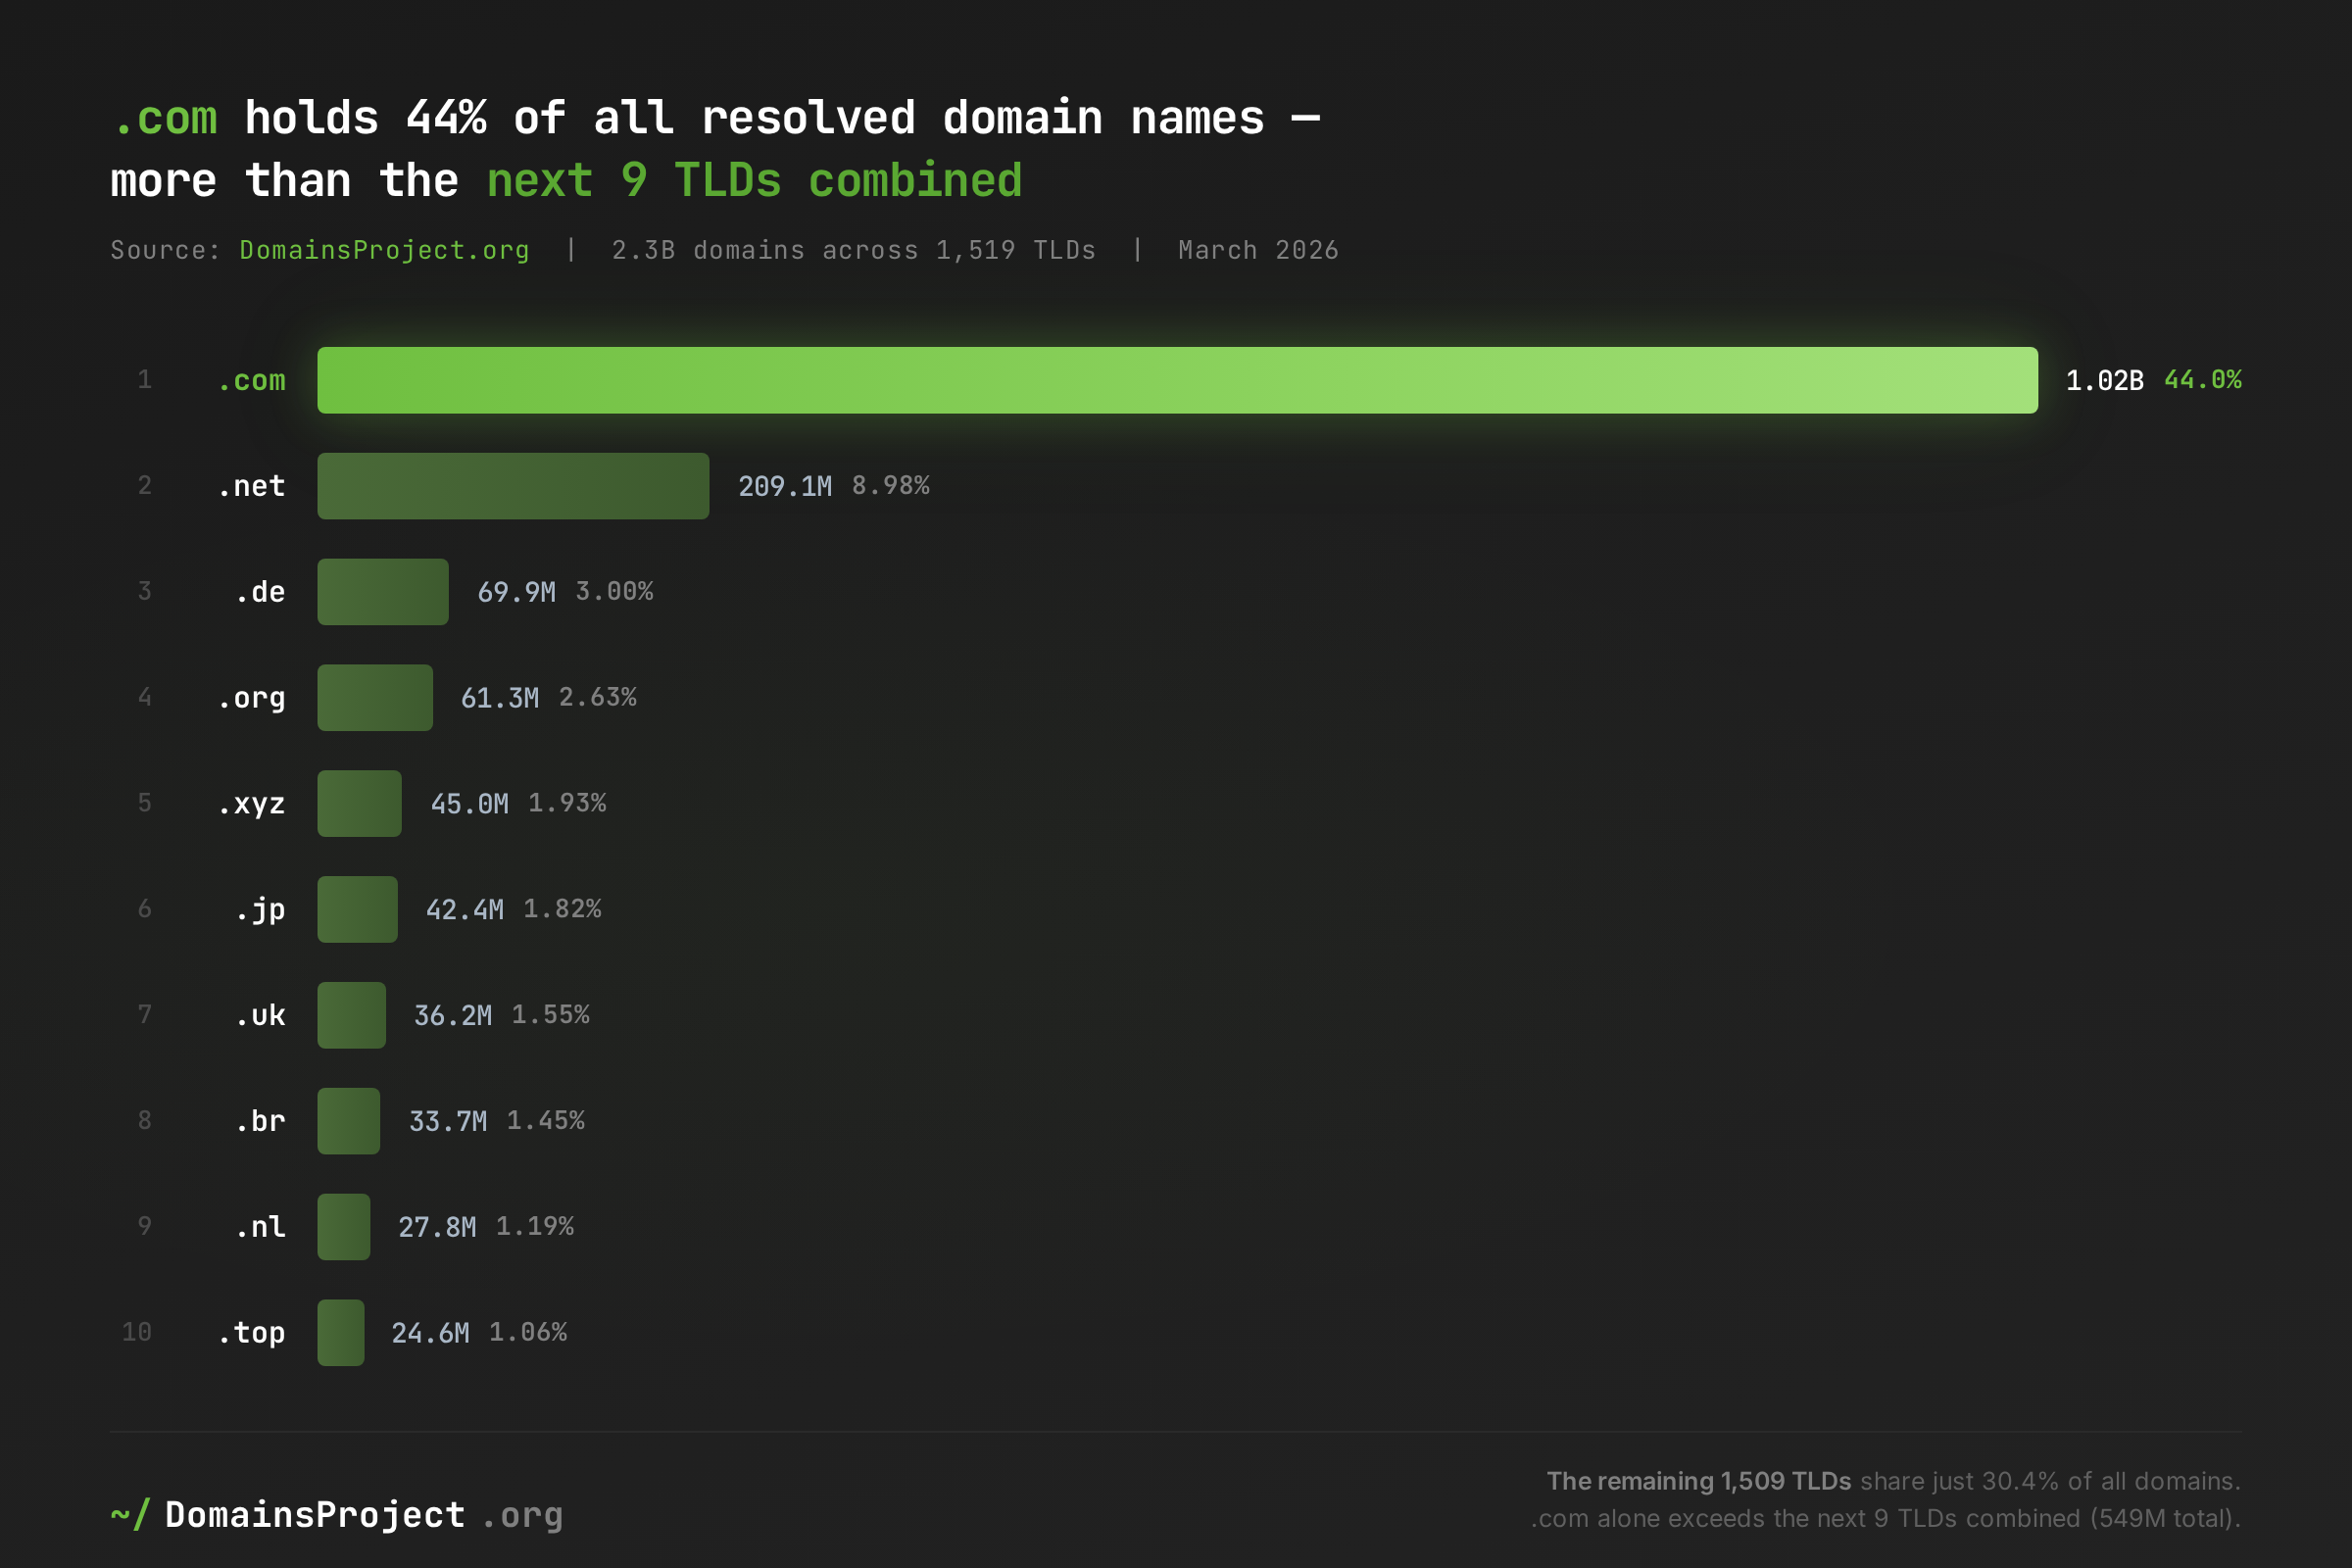
| 1 | .com | Legacy gTLD | 1,360,818,815 | 42.7% |
| 2 | .net | Legacy gTLD | 400,819,790 | 12.6% |
| 3 | .de | ccTLD | 117,679,029 | 3.7% |
| 4 | .org | Legacy gTLD | 74,404,646 | 2.3% |
| 5 | .jp | ccTLD | 73,446,024 | 2.3% |
| 6 | .cn | ccTLD | 52,157,104 | 1.6% |
| 7 | .xyz | New gTLD | 50,604,376 | 1.6% |
| 8 | .br | ccTLD | 50,303,337 | 1.6% |
| 9 | .uk | ccTLD | 43,805,896 | 1.4% |
| 10 | .fr | ccTLD | 43,106,389 | 1.4% |
.com is 3.4x larger than the second-place TLD, .net — and the gap is structural, not cyclical. The combined total of TLDs ranked 2 through 10 is roughly 906 million hostnames — still only two-thirds of .com's count. A single TLD holds more observed hostnames than the next nine put together.
The runner-up has changed since the original edition: .net, not a ccTLD, is now a clear #2 at 400.8 million hostnames. This is partly a hostname-counting artifact worth naming — .net is the default zone for an enormous amount of provider infrastructure (CDNs, dynamic-DNS, mail and hosting back-ends), so it accumulates subdomains far faster than registrations. By apex count .net is a distant also-ran; by observed-hostname count it is the Internet's second namespace. After .com and .net, no single TLD holds more than 3.7% of the namespace, and the field below #2 is a row of mature ccTLDs punctuated by one new gTLD, .xyz.
Concentration Metrics
| Metric | Value |
|---|---|
| Top 1 TLD share (.com) | 42.7% |
| Top 3 TLD share (.com, .net, .de) | 59.0% |
| Top 10 TLD share | 71.2% |
| Top 50 TLD share | 90.3% |
| TLDs with >1M hostnames | 121 |
| TLDs with <10K hostnames | 804 |
| Legacy gTLDs (.com/.net/.org/.info) share | 58.4% |
.com alone holds 42.7% of observed hostnames; the four legacy gTLDs together hold 58.4%. The namespace is wide but shallow: the top 50 TLDs cover 90.3% of everything, while 804 of the 1,511 TLDs hold fewer than 10,000 hostnames each. ICANN approved hundreds of new strings to dilute this concentration; registrants overwhelmingly chose the incumbents. .com and .net — both run by Verisign — together account for 55.3% of all observed hostnames, a single-operator footprint no other registry approaches.
Enterprise adoption tracks the data. External tallies of large-enterprise primary domains consistently find .com used by the overwhelming majority of the Fortune 500 — on the order of 99% — with the handful of exceptions clustered on .net. When the world's largest organizations converge on a single TLD, it stops being a market preference and becomes a dependency. Verisign's own filings and the Domain Name Industry Brief frame .com the same way: the default of record for commercial identity.
The Verisign Machine: ~$1.7 Billion from a Government-Granted Monopoly
Verisign's business model is straightforward: charge a per-year wholesale fee for every .com registration and renewal, against a registry base of roughly 161 million .com domains (about 173 million including .net). The cited figures below are from Verisign's FY2025 earnings release and SEC filings, not our crawl.
Verisign Financial Profile (FY2025, company filings)
| Metric | Value |
|---|---|
| Annual revenue | ~$1.66B |
| Operating income | ~$1.12B |
| Operating margin | ~68% |
| Net income | ~$826M |
| Employees | ~900 |
| Revenue per employee | ~$1.8M |
| .com/.net registry base | ~173.5M domains |
The cost to operate the .com registry is estimated at roughly $1–$3.50 per domain per year, against a wholesale price of $10.26. Competitive bids for comparable registry operations — like India's .in TLD — have historically come in at $0.70–$1.65 per domain. The American Economic Liberties Project has estimated a fair-market wholesale price for .com well below the actual $10.26. The gap between the operating cost and the wholesale price is the monopoly rent, and it scales directly with the registry base — a base our dataset shows underpins 42.7% of all observed hostnames.
.com Wholesale Pricing History (NTIA/ICANN records)
| Period | Wholesale Price | Event |
|---|---|---|
| 2000–2006 | $6.00 | Stable under early agreements |
| 2007–2011 | $6.42–$7.85 | 7% annual increases begin |
| 2012–2020 | $7.85 | Frozen by NTIA |
| Sep 2021 | $8.39 | Price cap removed (Amendment 35) |
| Sep 2022 | $8.97 | +7% |
| Sep 2023 | $9.59 | +7% |
| Sep 2024 | $10.26 | +7% (current) |
| 2030 (projected) | ~$13.42 | If all permitted increases taken |
Verisign has taken the maximum permitted 7% price increase every time it was allowed. From the 2012 freeze of $7.85 to the current $10.26, that is a 30.7% increase over a few years of active pricing, during a period of no meaningful service change measurable from the outside. If Verisign takes every permitted increase through the end of the current contract, .com wholesale would reach approximately $13.42 by 2030 — a 71% increase from the frozen price. Critically, none of this is constrained by competition: there is no second .com registry to undercut it.
The Network Effect: Why Alternatives Can't Compete
.com's dominance is self-reinforcing through at least four mechanisms that no marketing budget or ICANN policy has overcome.
Browser and User Behavior Lock-In
External recall research has repeatedly found that users are several times more likely to assume a website ends in .com regardless of its actual extension; a controlled GrowthBadger study put .com's memorability well ahead of the next-closest extension, .co. Every major browser still supports Ctrl+Enter to auto-append .com — a behavior hardcoded since the early 2000s. ICANN's own Nielsen consumer research found roughly 95% awareness of .com among Internet users, ahead of .net and .org, with legacy TLDs rated more trustworthy than new gTLDs as destinations. These are external signals, but our data is consistent with them: the incumbents hold 58.4% of observed hostnames despite fourteen years of competition.
Aftermarket Dominance
| Metric | .com | All Other TLDs |
|---|---|---|
| Share of dollar volume (recent year) | ~74% | ~26% |
| Share of transactions | ~59% | ~41% |
| Top 20 sales: .com domains | 19 of 20 | 1 of 20 |
| Sales exceeding $1M (2023–2024) | ~100% | ~0% |
(Aftermarket figures are from industry sale trackers, not our dataset.)
Nearly every domain sale exceeding $1 million in 2023 and 2024 was a .com. The record sale — ai.com at $70 million in February 2025 — sits well above the previous all-time high (CarInsurance.com at $49.7 million in 2010). The aftermarket doesn't merely favor .com; it is a .com market with other TLDs as a sideshow. This is the price signal of scarcity: the secondary market values .com at a multiple no other namespace approaches, which is itself a measure of lock-in.
The 1,200 gTLD Expansion That Didn't Work
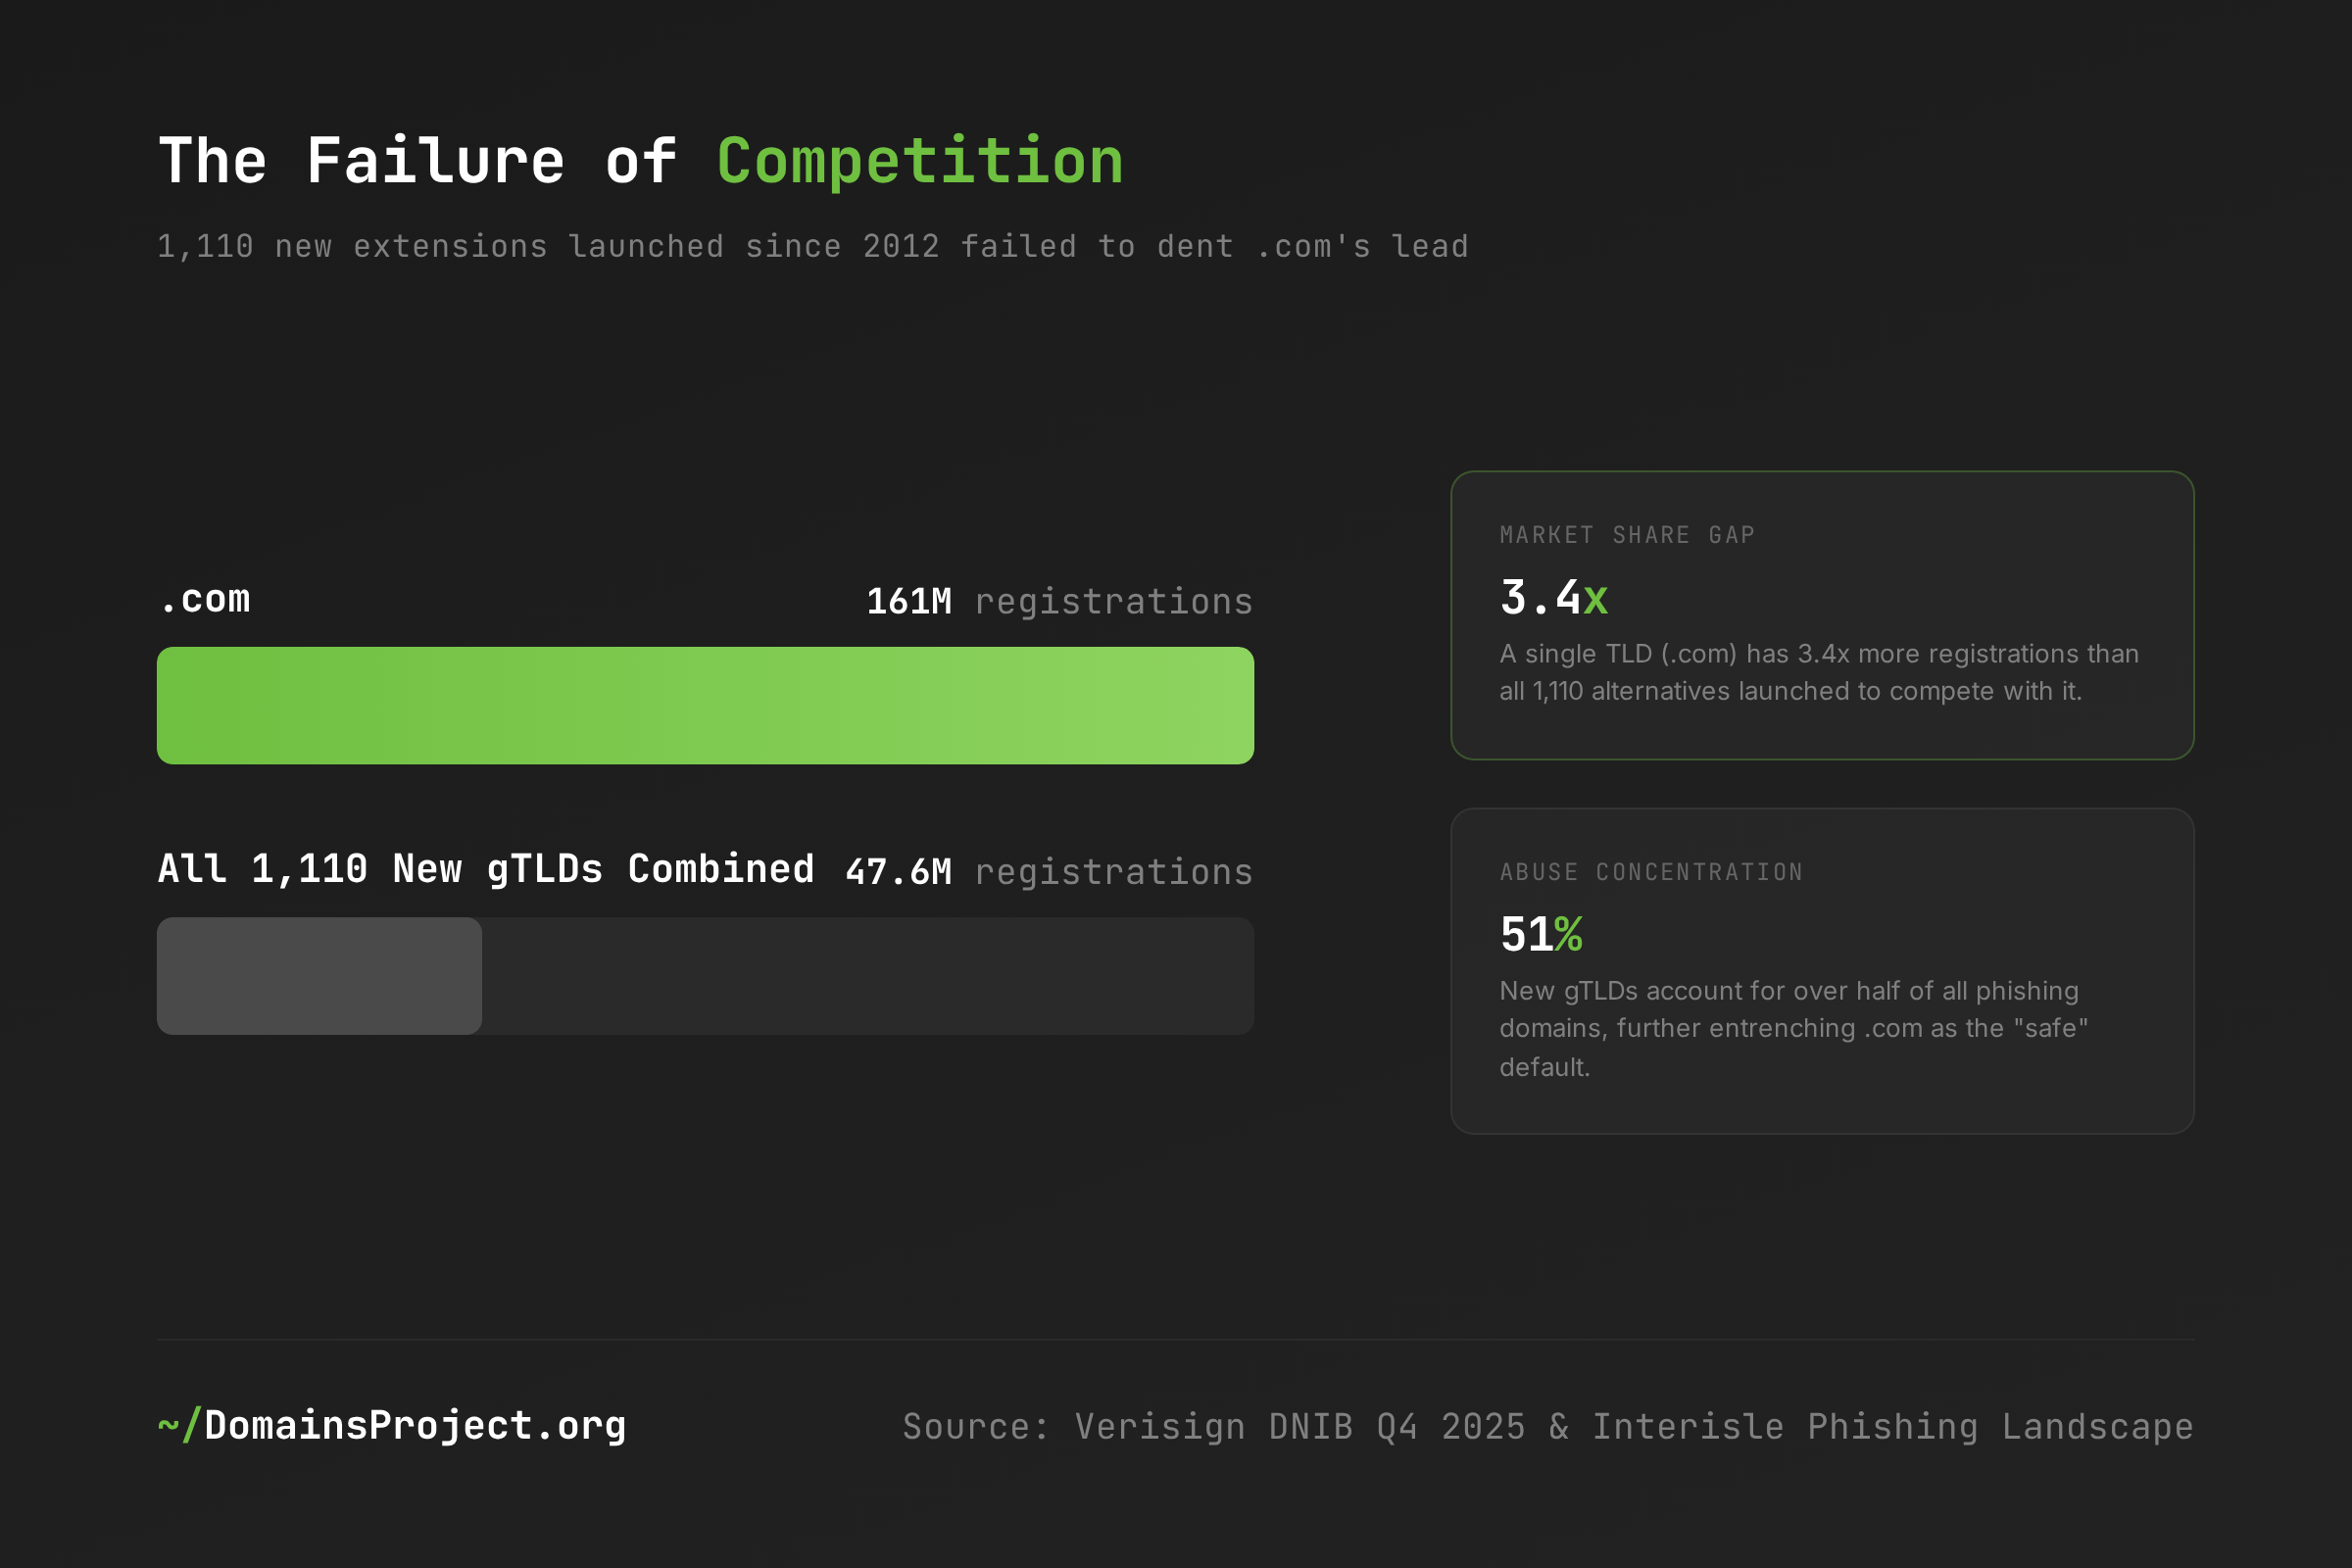
ICANN approved over 1,200 new TLD strings starting in 2012, charging $185,000 per application and collecting over $350 million in fees on the promise of "competition and choice." The result, fourteen years on, is concentration that barely moved:
| Metric | Value |
|---|---|
| .com share of observed hostnames | 42.7% |
| Entire new gTLD cohort share of observed hostnames | ~10% |
| Largest new gTLD (.xyz) | 50.6M hostnames (1.6%) |
| .xyz as share of .com | ~3.7% |
| New gTLDs with <10K hostnames | hundreds |
The largest new gTLD, .xyz, holds about 3.7% of .com's hostname count, and the entire post-2012 cohort holds roughly a quarter of .com's. The new gTLD "expansion" produced volume but not competition — only one string, .xyz, ever reached the scale of a legacy TLD, and it did so through a corporate endorsement and crypto adoption that no ICANN policy could engineer (the full story is in our .xyz companion analysis). Worse, new gTLDs carry a disproportionate abuse burden: industry phishing telemetry consistently finds the low-cost end of the new-gTLD cohort over-represented in phishing relative to its share of registrations. That reputation problem further reinforces .com's position as the safe default.
Even Google couldn't crack it. Google launched .app and .dev with a built-in security advantage (mandatory HTTPS via HSTS preloading) — and our dataset still puts them at 6.7M and 4.4M observed hostnames respectively, against .com's 1.36 billion. In 2023 Google sold its registrar business to Squarespace and stepped back from the consumer domain space. Google's own products — Gmail, YouTube, Google Cloud — all run on google.com.
Switching Costs
The lock-in is not psychological — it is operational. Changing a domain means updating every inbound link, every email configuration, every business card, every SEO signal, every API endpoint, every SSL certificate, and every piece of brand collateral. Academic research on network effects in the domain system describes how these switching costs produce "monopolistic markets where dominance results in market lock-in — even if the given provider offers inferior products." For .com, the provider isn't inferior — the alternatives simply cannot overcome the compounding advantage of four decades of path dependence.
Does It Resolve? Even the Giant Has a Dark Half
Holding 42.7% of the namespace is one claim; being live is another. To separate them we cross-referenced .com's observed hostnames against our 9 June 2026 A-record crawl and measured what share still returns a live IPv4 address — then placed .com against its legacy peers and the whole-namespace baseline.
| TLD | Type | Observed Hostnames | Live A Record | Resolution Rate |
|---|---|---|---|---|
| .net | Legacy gTLD | 400,819,790 | 291,129,654 | 72.6% |
| .com | Legacy gTLD | 1,360,818,815 | 777,885,100 | 57.2% |
| .org | Legacy gTLD | 74,404,646 | 41,448,912 | 55.7% |
| .info | Legacy gTLD | 24,103,175 | 10,703,705 | 44.4% |
| Whole namespace | — | 3,183,285,503 | 1.87B | 58.9% |
Only 57.2% of observed .com hostnames return a live A record — slightly below the 58.9% whole-namespace baseline and well behind .net's 72.6%. In absolute terms that is enormous: roughly 778 million resolving .com hostnames form the live core of the commercial Internet, but nearly 583 million observed .com hostnames no longer answer — expired registrations, retired subdomains, and abandoned infrastructure that our crawl has seen but that no longer resolve. The dominance is real, and so is the dark fraction.
The resolution gradient is consistent with .net's infrastructure role. .net resolves higher (72.6%) precisely because so much of its mass is provider plumbing — CDN edge nodes and dynamic-DNS hostnames exist because they point at something. .com's lower 57.2% reflects its broader, churnier registrant base: the world's commercial default attracts both the live giants and a long tail of registered-but-dormant names. .info, a legacy gTLD with a long-standing abuse reputation, sits at just 44.4%, quantifying its bulk-registration problem. The takeaway for risk modeling: even the most resilient registry on the planet sits atop a namespace where more than four in ten observed names are dark. (Caveat: a live A record can point at a parking page, and IPv6-only names read as non-resolving — so 57.2% is a liveness floor, not an active-site census.)
The Infrastructure Bet: Hundreds of Billions of Queries a Day, One Registry
Verisign reports processing on the order of hundreds of billions of DNS queries per day for .com and .net combined — a volume that has grown steadily, driven in part by AI agents and automated crawling. The company operates two of the Internet's 13 root name servers (A-root and J-root) across more than 100 global anycast instances, and maintains capacity well above peak observed load.
The Uptime Paradox (company-reported)
| Metric | Value |
|---|---|
| Consecutive years of reported 100% .com DNS uptime | 28 |
| DNS queries processed per day (.com + .net) | Hundreds of billions |
| Root servers operated | 2 of 13 (A-root, J-root) |
| Global anycast instances | 100+ |
| .com share of observed hostnames (our data) | 42.7% |
Verisign has reported more than two decades of uninterrupted .com DNS resolution — an engineering achievement that simultaneously justifies its existence and obscures its risk. The 2002 DDoS attack that took down most of the root servers left Verisign's .com infrastructure untouched; the 2016 Mirai attack against Dyn knocked out Twitter, Netflix, and PayPal but didn't affect .com resolution because it targeted a different DNS layer.
The paradox: Verisign's reliability makes the dependency invisible. Because .com never goes down, organizations never build alternatives. Industry surveys consistently find that only a minority of large enterprises employ DNS redundancy. Our data sharpens the stakes — since .com underpins 42.7% of all observed hostnames, a .com-specific resolution failure would touch over four in ten names on the functional Internet, and almost no one has a contingency plan for it.
The Single-Operator Risk
The risk to .com is not technical failure. Verisign's infrastructure is among the most resilient on the planet. The risk is structural: every .com domain on Earth depends on one company (Verisign) continuing to operate, one government (the United States) continuing to authorize it, and one contract (the NTIA Cooperative Agreement) that auto-renews unless the government actively intervenes. No alternative .com registry operator exists. No competitive bid has ever been conducted. No backup plan has been disclosed.
The Governance Gap: 9,000 Comments, Zero Changes
The .com monopoly is not a market outcome. It is a government policy decision — renewed, reinforced, and defended by two parallel agreements between Verisign, ICANN, and the US Department of Commerce.
The Contract Structure
| Agreement | Authority | Current Term | Key Provision |
|---|---|---|---|
| NTIA Cooperative Agreement | US Dept. of Commerce | Through ~2030 (renewed Aug 2024) | Auto-renews unless government acts |
| .com Registry Agreement | ICANN | Through Dec 2030 (renewed Nov 2024) | 7% annual price increases in years 3–6 of each cycle |
Amendment 35 (October 2018) was the turning point. It removed NTIA's contractual lever to initiate competitive bidding for the .com registry and granted Verisign authority to raise prices by up to 7% annually — in four of every six years — without cost justification. The DOJ's own Antitrust Division had warned in 2008 that Verisign "possesses significant market power" and that registrants "do not perceive other TLDs as substitutes" — a finding our resolution data is consistent with, since the alternatives are both smaller and, in the promotional cohort, far less live. The price cap was removed anyway.
The Public Comment That Changed Nothing
When ICANN proposed allowing .com price increases in 2020, it received 9,040 public comments — for an organization that typically receives fewer than 50 — and the overwhelming majority opposed the increases. ICANN approved them anyway, stating it "was not a price regulator." In the same deal, Verisign agreed to pay ICANN $20 million over five years, a payment critics characterized as a "kickback" for approving the price hikes.
The Regulatory Response
In November 2024, Senator Elizabeth Warren and Representative Jerry Nadler wrote to the DOJ and NTIA urging an investigation into whether Verisign holds "monopoly power in violation of the Sherman Act," citing a 30%+ price increase since 2018 with no service improvement and stock buybacks worth a large share of revenue. NTIA itself acknowledged that "a reduction in .com prices would be in the public interest" but stated it "does not have authority to set .com domain prices." Three days after the Warren–Nadler letter, ICANN renewed Verisign's .com contract through 2030.
The Geopolitical Dimension
.com is US-controlled infrastructure in a fragmenting world. Verisign is a Virginia corporation subject to US sanctions law, and US authorities have seized .com domains tied to sanctioned entities because the registry falls under US jurisdiction. The response from adversary states has been structural: several governments have moved to build sovereign DNS alternatives capable of functioning if disconnected from the global Internet. The same concentration risk that drives those efforts applies equally to every country and business relying on .com — they simply haven't acted on it. (Per project policy, we do not enumerate the Russian-administered TLDs involved in that fragmentation, and they are excluded from all data here.)
What's at Stake
The .com concentration data has concrete implications:
- 42.7% of all observed hostnames resolve under a single registry operator with zero competitors — a concentration level that exceeds the leaders in cloud, search, and payments, all of which face at least some competition. .com and .net together, both Verisign-run, account for 55.3%.
- Only 57.2% of observed .com hostnames return a live A record — roughly 583 million observed .com names no longer answer in DNS. The functional .com namespace is about 778 million resolving hostnames: still the largest live namespace on Earth by a wide margin, but materially smaller than the headline count, which matters for any model that equates registry size with live exposure.
- Verisign's ~68% operating margin on a government-granted monopoly generates roughly $1.1 billion in annual operating income — with wholesale prices projected to reach ~$13.42 by 2030, a 71% rise from the 2012 freeze, and no competitive mechanism to constrain it.
- The post-2012 new gTLD cohort holds only about 10% of observed hostnames after fourteen years — the namespace expansion designed to reduce .com concentration did not, and the low-cost end of that cohort's outsized share of phishing telemetry further entrenches .com as the trusted default.
- US jurisdiction over .com makes every .com domain subject to American sanctions and seizure — a geopolitical risk that several governments have explicitly moved to mitigate by building sovereign DNS alternatives.
- 9,040 public comments opposing .com price increases were overridden by ICANN — the governance system designed to steward the namespace has demonstrated it will not constrain the monopoly, even when the regulator (NTIA) acknowledges that lower prices would serve the public interest.
What Would Help
1. Enterprise security teams: build .com failure into your threat models. .com has never gone down — which is exactly why most organizations have no contingency for it. With 42.7% of observed hostnames under one registry and only 57.2% of them live, DNS redundancy across multiple TLDs, multi-provider DNS, and documented failover for a .com resolution outage belong in every resilience plan. Start with our TLD statistics dashboard to understand your namespace exposure.
2. Regulators: treat .com like the critical infrastructure it is. Google was found guilty of Sherman Act violations for a 90% search share in a market where users can switch in seconds. Verisign operates at 100% share in a market where switching is operationally impossible. The DOJ acknowledged Verisign's market power in 2008; eighteen years and multiple price increases later, no antitrust action has been taken.
3. ICANN: require competitive bidding for .com. No competitive bid for the .com registry has ever been conducted in 30+ years of Verisign's control, and the cooperative agreement auto-renews unless the government intervenes. A legitimate competitive process — even if Verisign wins it — would establish market pricing, force operational redundancy planning, and restore credibility to a governance system that approved price increases over 9,000 objections.
4. Registries and infrastructure operators: invest in namespace diversification. The .com monoculture is a systemic risk. Our resolution data shows the alternatives are not yet credible substitutes — the promotional new gTLDs resolve far below .com, and only one new gTLD has ever reached legacy scale. Alternative TLDs with strong abuse controls, competitive pricing, and demonstrated resolving adoption — not just marketing — are the only path to reducing concentration.
5. Security researchers: monitor .com's monopoly economics, not just its DNS. The technical infrastructure is resilient; the governance infrastructure is not. Price increases, contract renewals, and regulatory actions are the vectors through which .com's monopoly affects the broader Internet. Track the .com statistics page alongside Verisign's SEC filings and ICANN Board resolutions for a complete picture.
This analysis was conducted using the DomainsProject dataset, which continuously indexes hostnames across the active TLDs in the IANA root zone (Russian-administered TLDs excluded). Hostname counts reflect the June 2026 snapshot (1,511 TLDs, 3,183,285,503 observed hostnames); resolution figures reflect our 9 June 2026 A-record crawl. Registry registration figures are sourced from Verisign SEC filings and the Domain Name Industry Brief; financial data is from Verisign's FY2025 earnings release; regulatory data is from NTIA, ICANN, and congressional correspondence; aftermarket figures are from industry sale trackers. Explore .com statistics on our TLD statistics page, browse the full TLD dashboard, or access the complete dataset for your own research.