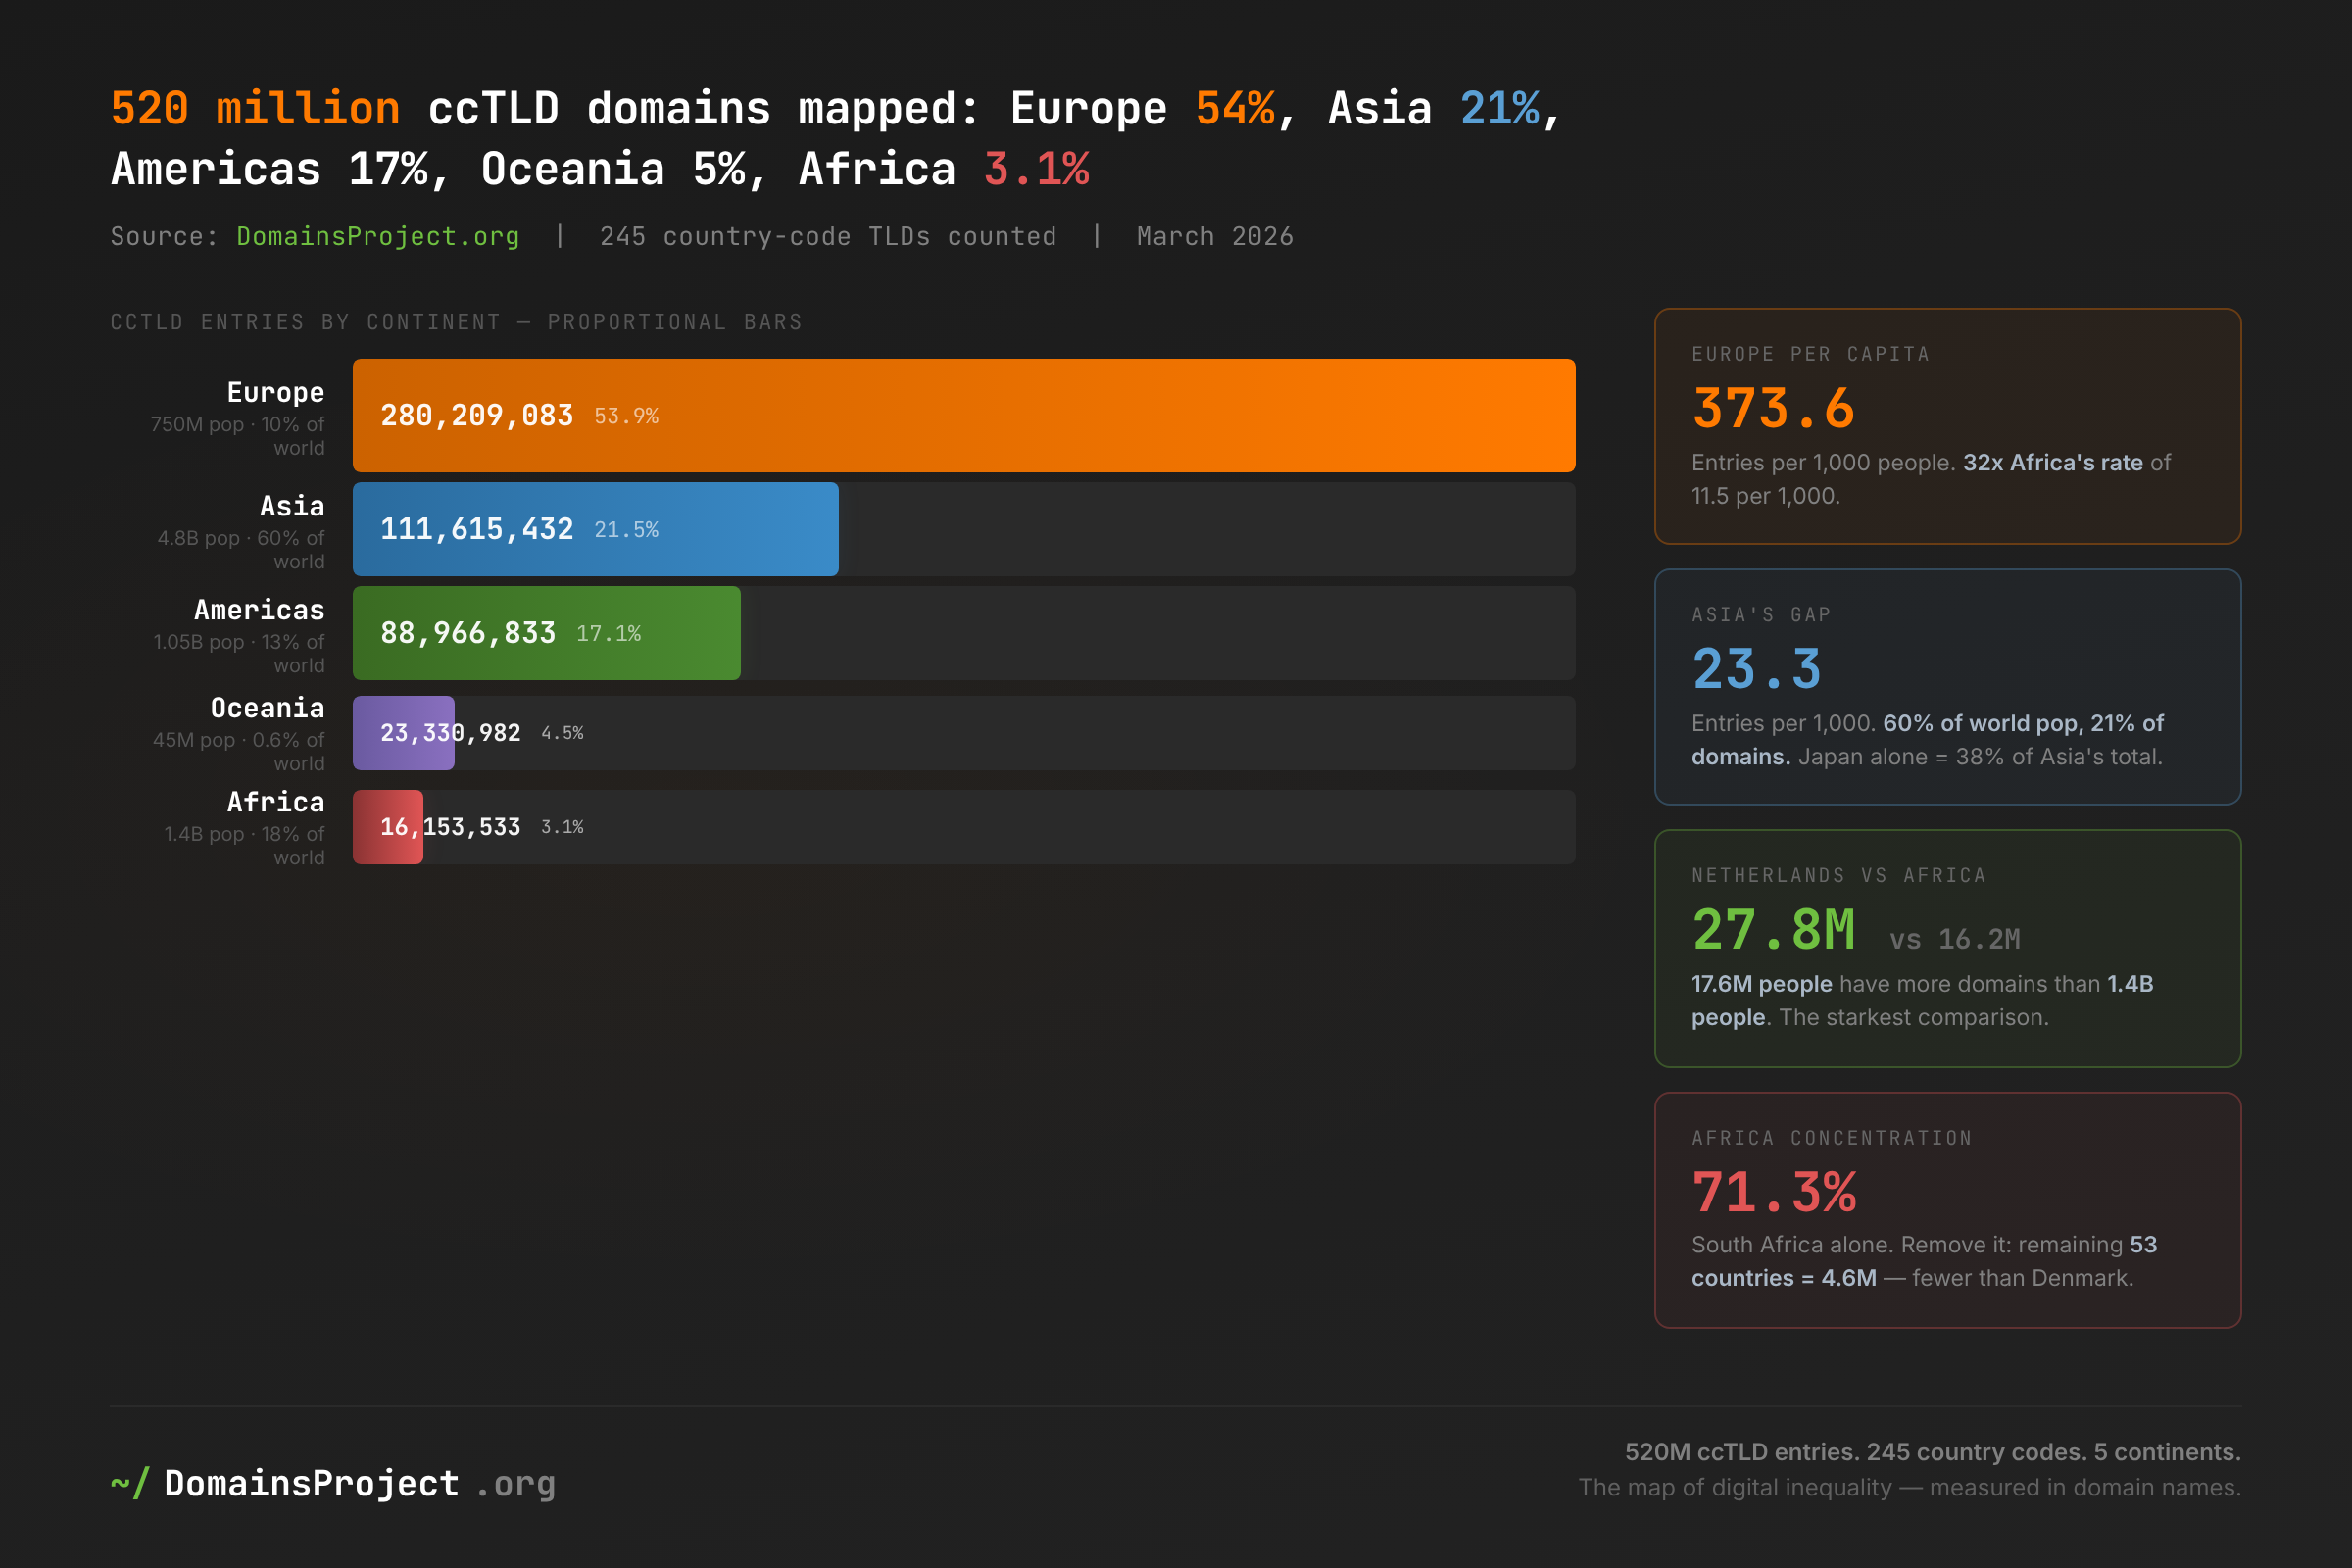
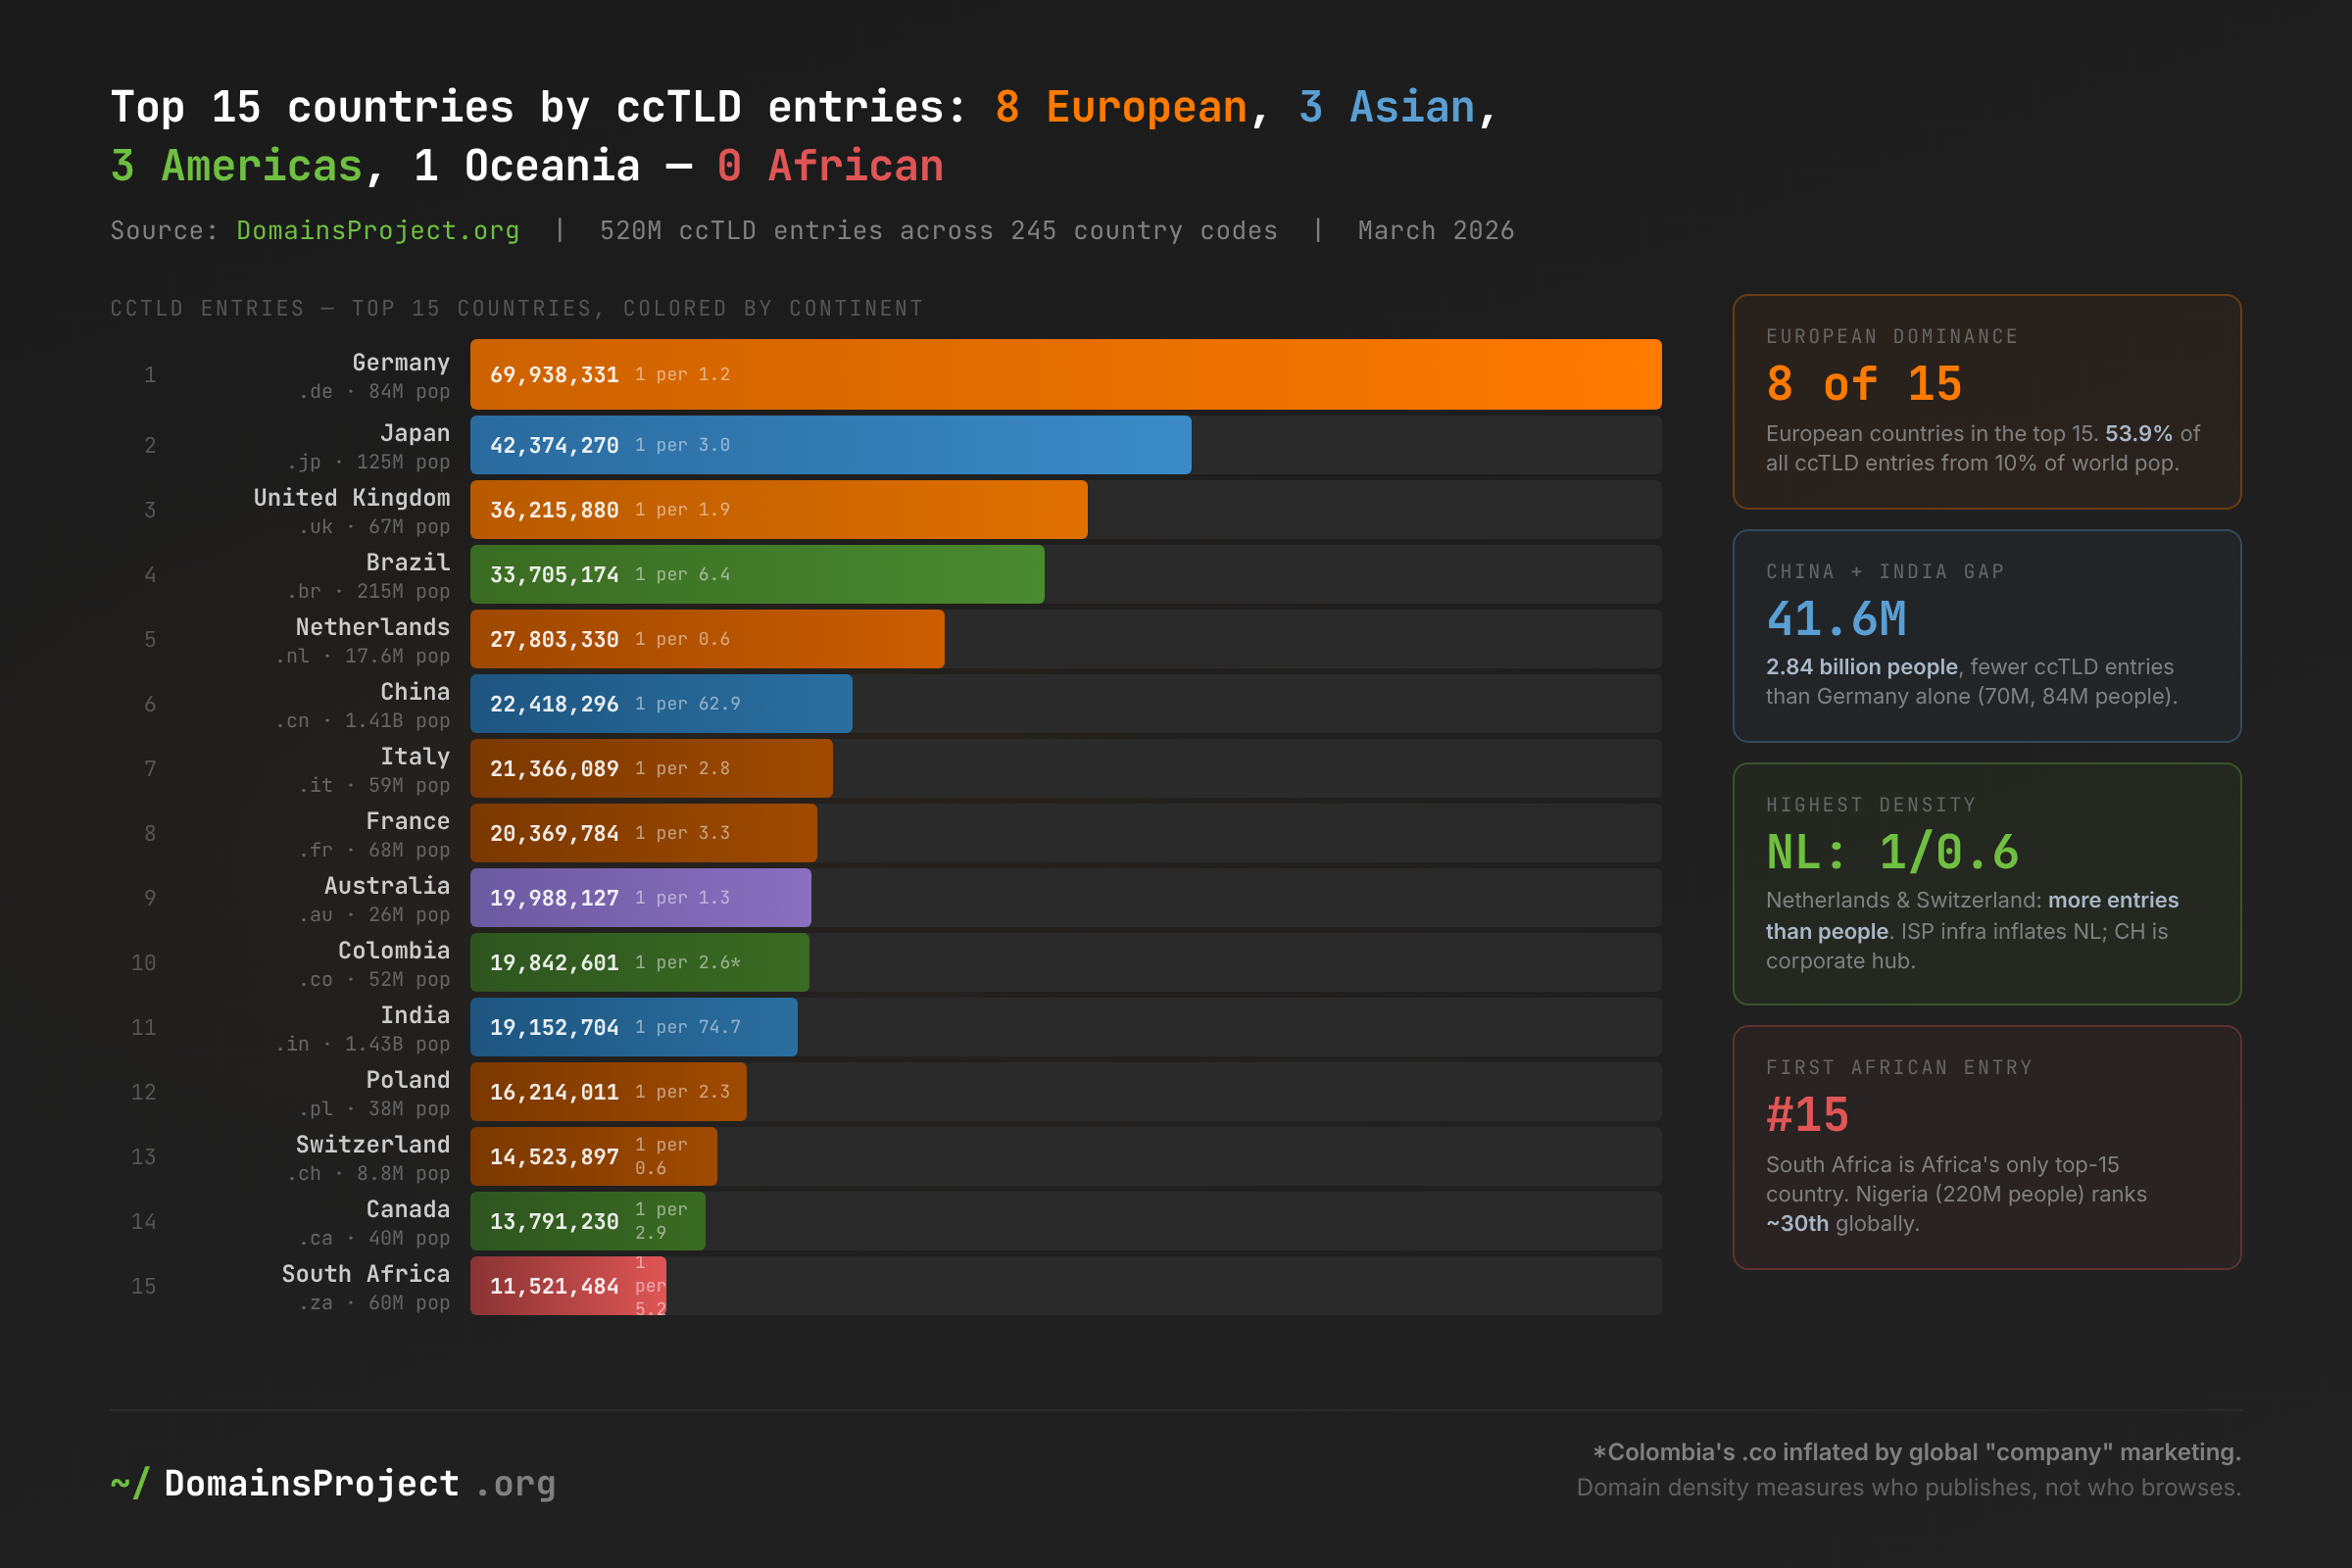
Updated 23 June 2026 — this post has been rebuilt on the June 2026 dataset snapshot (1,511 active TLDs, 3,183,285,503 observed hostnames; 971,436,501 of them under country-code TLDs) and triangulated against our 9 June 2026 A-record crawl. The original March 2026 edition predated our data-journalism format standard and our first-party DNS resolution data, and under-counted the ccTLD namespace (it reported 520 million; a full recount finds 971 million — a measurement correction, not growth). This revision adds a full Methodology section, replaces loose "domain" language with deduplicated observed-hostname counts, and — most importantly — separates genuine national usage from the Freenom free-domain ccTLDs (.tk, .ga, .ml, .cf, .gq), which massively inflate Africa and Oceania while resolving at under 2%. Several relative claims flipped: the Netherlands no longer outweighs the entire raw African total, the Americas' #2 is now Canada rather than Colombia, and Africa is reported both raw and excluding Freenom. Where the numbers moved, the Methodology explains why.
If you plotted every country-code hostname in the world on a map, you would see a planet that looks nothing like a population chart. Europe would glow white-hot — 497 million ccTLD hostnames from 84 million Germans, 68 million Britons, 18 million Dutch residents. Asia would be surprisingly dim — 201 million from a continent of 4.8 billion people. Africa would be nearly invisible, and most of what you did see there would be a mirage: free, globally-registered domains that no African ever used and that almost never answer in DNS.
The conventional framing of "digital divide" focuses on internet access — how many people are online. But access is not presence. China has well over a billion internet users and 52 million ccTLD hostnames. Germany has roughly 78 million internet users and 118 million ccTLD hostnames. The ratio between being online and maintaining a national namespace ranges from near-parity in Europe to a wide gap in Asia. Internet access tells you who can consume. Maintaining a domain namespace is a rough, imperfect proxy for who publishes — and a far more uneven one.
We counted every observed hostname under every country-code TLD in the DomainsProject dataset — 971,436,501 ccTLD hostnames, 30.5% of the whole 3.18-billion-hostname namespace — and mapped each ccTLD to the continent of the territory it was delegated to, using ISO 3166 / UN geoscheme classification. We then cross-referenced every figure against our 9 June 2026 A-record crawl to test how much of each continent's namespace actually resolves.
The headline: Europe holds 51.2% of all mapped ccTLD hostnames with 497 million, from roughly a tenth of the world's population. Asia holds 20.7% with 201 million from 60% of the world's population. Germany alone — 118 million hostnames — holds more than China, India, and Indonesia combined (81 million), and more than the entire African continent's raw total (46 million). But the African total is the data's biggest trap: nearly half of it is Freenom free-domain churn that resolves at under 2%. Strip that out and real African usage is roughly 25 million hostnames, three-fifths of it South African. This is not only a gap in internet access — it is a gap in who maintains durable, resolving namespace of their own.
The Data
DomainsProject continuously crawls and indexes hostnames across every delegated TLD in the IANA root zone. For this analysis, we counted all observed hostnames under every country-code TLD and grouped them by the continent of the delegated territory. This covers ccTLD hostnames only — hostnames under generic TLDs (.com, .net, .org, .xyz, etc.) are not attributable to a specific country and are excluded.
| Category | Count | Coverage |
|---|---|---|
| Active TLDs tracked | 1,511 | IANA root zone (Russian-administered TLDs excluded) |
| ccTLD observed hostnames | 971,436,501 | 30.5% of dataset |
| Mapped to a continent | 939,368,820 | 96.7% of ccTLD hostnames |
| Unmapped / repurposed-global ccTLDs | 32,067,681 | 3.3% (e.g. .io, .cc — see Methodology) |
| Continents covered | 5 | Europe, Asia, Americas, Oceania, Africa |
These counts include subdomains, which is why some ccTLDs read far larger than their registry registration totals — a single registered domain can contribute dozens of observed hostnames. The Netherlands (.nl) shows 36.3 million observed hostnames against roughly 6 million SIDN registrations; the difference is subdomains and ISP infrastructure. This is consistent across all countries: we count observed hostnames under a ccTLD, not registry second-level registrations. The comparisons below are hostname-to-hostname, but the gap between observed hostnames and registrations — and the share that actually resolves — is exactly where the interesting structure lives.
Methodology
This post maps a namespace onto geography and makes per-capita and cross-continent claims, so the definitions matter.
- Observed hostname (FQDN). The unit we count. A fully-qualified name we have seen in DNS —
example.de,www.example.de, andmail.example.deare three distinct hostnames under one registrable domain. Our per-ccTLD totals are deduplicated observed hostnames, not registry registrations and not apex-only counts; a single registered domain typically contributes several hostnames. - Continent assignment. Each ccTLD is assigned to the continent of the ISO 3166-1 territory it was delegated to (.de → Europe, .jp → Asia, .br → Americas, .au → Oceania, .za → Africa). The Americas are treated as one continent. Mapping is by territory of delegation, not by where registrants actually live — a distinction that matters enormously for repurposed ccTLDs, addressed next.
- Repurposed and "global-commercial" ccTLDs. A handful of ccTLDs are sold worldwide as generic strings and tell us almost nothing about their home territory's internet usage: .io (British Indian Ocean Territory, used by tech startups), .cc (Cocos Islands), .co (Colombia, marketed as a .com alternative), .me (Montenegro), .tv (Tuvalu), and .ai (Anguilla). We leave .io and .cc unmapped (together 25.4 million hostnames) because attributing them to a territory of a few thousand people would be meaningless. Where a repurposed ccTLD is mapped to its territory's continent (.co → Americas, .tv → Oceania, .me → Europe), we flag it in the relevant section and do not read it as national usage. This post is about national namespaces; repurposed strings are noted and discounted, never used to support a country-level claim.
- Freenom free-domain ccTLDs. Five ccTLDs — .tk (Tokelau), .ga (Gabon), .ml (Mali), .cf (Central African Republic), and .gq (Equatorial Guinea) — were operated for years under the Freenom model, which gave domains away at no cost worldwide. The result is namespaces dominated by free, globally-registered, largely-abandoned or abusive domains that bear no relation to national usage in the host territory. Their A-resolution rates (1.4%–2.5%) confirm this: almost nothing in them answers in DNS. We define this class explicitly and, for Africa and Oceania, report totals both raw and excluding Freenom. Treat the Freenom figures as dead inventory, not as Gabonese or Tokelauan internet adoption.
- Resolution. Our 9 June 2026 A-record crawl records hostnames that returned a positive answer (
NOERRORwith at least one IPv4 address). A ccTLD's resolution rate is the share of its observed hostnames in that positive set. A name absent from it — because it returnedNXDOMAIN/SERVFAIL/no answer, resolves only over IPv6, or was not reached — counts as non-resolving. The rate is a conservative liveness floor: a live A record can still point at a parking page, and an IPv6-only name reads as dead here. The whole-namespace rate is 58.9%; we use the per-ccTLD rate throughout to separate maintained namespace from abandoned inventory. - Population and per-capita. Population figures are UN 2025 estimates for the territory. Per-capita ratios divide population by observed-hostname count and are relative indicators, not precise domain-density measures — they conflate registrations and subdomains and ignore the resolution gap. We use them only for order-of-magnitude comparison.
- Russian-administered TLDs excluded. Per project policy, Russian-administered TLDs are excluded from the dataset and from every table, total, and per-capita figure here; the country "Russia" appears only in population/geography context, never as a namespace.
Dataset vs. registry counts. Our continent totals diverge from any registry tally for three reasons: we count observed hostnames (which inflates relative to apex registrations), we count only names our crawl has seen (which deflates relative to zone files of never-used registrations), and we exclude Russian-administered TLDs. The net effect varies by ccTLD — a heavily-subdomained namespace reads high, a free-domain churn namespace reads high on count but collapses on resolution. Read these as a map of the observed, partly-functional national namespace, not of registry revenue or of population online.
Known limitations. This is a single snapshot; it measures presence and resolution, not traffic or uptime. Hostname-weighted counting gives a thousand-subdomain hosting platform the same arithmetic weight as a thousand one-page sites. Continent assignment by territory of delegation mislabels repurposed ccTLDs (which we flag and discount). DNS visibility varies by region. The per-ccTLD breakdown is reproducible from the country statistics page, the TLD statistics dashboard, and the dataset.
The Scorecard: Five Continents, One Story
ccTLD Hostnames by Continent
| Rank | Continent | ccTLD Hostnames | Share of mapped ccTLDs | Approx. Population | Hostnames per 1,000 People |
|---|---|---|---|---|---|
| 1 | Europe | 497,126,927 | 51.2% | ~745M | 667 |
| 2 | Asia | 200,656,900 | 20.7% | ~4,750M | 42 |
| 3 | Americas | 143,038,384 | 14.7% | ~1,030M | 139 |
| 4 | Oceania | 52,281,816 | 5.4% | ~45M | 1,162 |
| 5 | Africa | 46,264,793 | 4.8% | ~1,480M | 31 |
| Mapped total | 939,368,820 | 96.7% |
Shares are computed over the 971.4M ccTLD total; the remaining 3.3% (32.1M) sits in unmapped repurposed-global ccTLDs such as .io and .cc.
Europe holds more mapped ccTLD hostnames than every other continent combined. With 497 million against Asia's 201 million and Africa's 46 million, European dominance is not a marginal lead — it is a structural asymmetry. Europe has roughly a tenth of the world's population and 51% of mapped ccTLD hostnames; Asia has 60% of the population and 21% of the hostnames. This is consistent with four decades of open-web culture, cheap and accessible registries (DENIC offers .de to registrars for a few euros a year), and ccTLDs designed for mass adoption rather than restricted national use.
Africa's 4.8% raw share is the data's most misleading number — and the resolution crawl proves it. Of Africa's 46.3 million hostnames, 21.5 million (46%) sit in the four African Freenom ccTLDs (.ga, .ml, .cf, .gq), which together resolve at under 2%. Excluding them, the real African namespace is roughly 24.8 million hostnames, and South Africa's .za alone accounts for three-fifths of that. We return to this in the Africa section; for now, read Africa's raw 4.8% as an upper bound built largely on dead inventory, and ~2.6% (of the ccTLD total) as the floor of genuinely-maintained African namespace.
Oceania's per-capita figure is the highest on the table — and is similarly distorted. Oceania reads 1,162 hostnames per 1,000 people, but .tk (Tokelau, 7.2 million, also a Freenom string) accounts for 14% of the continent's total and resolves at 2.5%. Strip .tk and Oceania is essentially Australia (.au, 32.2 million) plus New Zealand (.nz, 6.0 million) — a small, high-density, English-language internet that behaves like a detached piece of Europe.
Concentration Within Continents
| Continent | #1 Country | #1 Share | #2 Country | Top 2 Share |
|---|---|---|---|---|
| Europe | Germany (.de, 117.7M) | 23.7% | United Kingdom (.uk, 43.8M) | 32.5% |
| Asia | Japan (.jp, 73.4M) | 36.6% | China (.cn, 52.2M) | 62.6% |
| Americas | Brazil (.br, 50.3M) | 35.2% | Canada (.ca, 22.1M) | 50.6% |
| Oceania (ex-Freenom) | Australia (.au, 32.2M) | 71.4% | New Zealand (.nz, 6.0M) | 84.6% |
| Africa (ex-Freenom) | South Africa (.za, 15.0M) | 60.4% | Nigeria (.ng, 2.1M) | 68.8% |
Every continent except Europe is dominated by one or two national ccTLDs. In real (ex-Freenom) Africa, South Africa holds 60% of all hostnames — 15.0 million out of 24.8 million. In Oceania, Australia holds 71% of the ex-Freenom total. In the Americas, Brazil and Canada together hold 51%; in Asia, Japan and China hold 63%. Only Europe spreads its namespace across a dozen countries with meaningful volume, which is itself the signature of mature, distributed open-web adoption rather than a single anchor economy.
Europe: The Domain Supercontinent
Europe's 497 million ccTLD hostnames come from a deep bench. More than a dozen European countries have over 5 million observed hostnames each — no other continent has more than three.
European ccTLD Hostnames (Top 12)
| Rank | Country | ccTLD | Hostnames | A-Resolution | Population | Hostnames per Capita |
|---|---|---|---|---|---|---|
| 1 | Germany | .de | 117,679,029 | 75.2% | 84.5M | 1.39 |
| 2 | United Kingdom | .uk | 43,805,896 | 62.6% | 68.4M | 0.64 |
| 3 | France | .fr | 43,106,389 | 68.5% | 68.3M | 0.63 |
| 4 | Netherlands | .nl | 36,326,261 | 71.7% | 17.9M | 2.03 |
| 5 | Italy | .it | 33,130,745 | 81.3% | 58.8M | 0.56 |
| 6 | Poland | .pl | 29,314,882 | 73.9% | 38.0M | 0.77 |
| 7 | Switzerland | .ch | 17,788,317 | 69.9% | 8.9M | 2.00 |
| 8 | Sweden | .se | 15,477,824 | 63.0% | 10.6M | 1.46 |
| 9 | Spain | .es | 14,754,989 | 76.7% | 47.9M | 0.31 |
| 10 | Belgium | .be | 11,967,717 | 78.2% | 11.7M | 1.02 |
| 11 | Hungary | .hu | 11,443,697 | 77.1% | 9.6M | 1.19 |
| 12 | Czech Republic | .cz | 10,660,792 | 65.8% | 10.7M | 1.00 |
Germany's .de is the largest national namespace on Earth at 117.7 million hostnames — and one of the most live, at 75.2% A-resolution against the 58.9% whole-namespace rate. That combination is the defining European pattern: not just a big namespace, but a maintained one, where three-quarters of what we observe still answers in DNS. .de is larger than the entire mapped Asian continent's #2 and #3 ccTLDs combined, and its resolution rate sits 16 points above the global average.
The Netherlands and Switzerland are the density leaders at roughly two hostnames per capita — far above their population weight, consistent with their roles as European hosting and financial-infrastructure hubs rather than with domestic market size. Both also resolve well (.nl 71.7%, .ch 69.9%), so this is genuine maintained infrastructure, not parked inventory inflating the count.
Italy's .it is Europe's resolution champion at 81.3% — the highest live share of any major European ccTLD. A registered .it tends to be a .it in use: an Italian business, institution, or individual with a reason to keep the lights on. By contrast, the UK's .uk resolves at a comparatively modest 62.6%, suggesting a larger tail of registered-but-inactive names — a reminder that raw rank and functional namespace are not the same thing.
Asia: 4.75 Billion People, 201 Million Hostnames
Asia's 201 million ccTLD hostnames represent 20.7% of the mapped ccTLD namespace — from a continent that holds about 60% of the world's population.
Asian ccTLD Hostnames (Top 8)
| Rank | Country | ccTLD | Hostnames | A-Resolution | Population | Hostnames per Capita |
|---|---|---|---|---|---|---|
| 1 | Japan | .jp | 73,446,024 | 76.7% | 124.0M | 0.59 |
| 2 | China | .cn | 52,157,104 | 49.0% | 1,410.0M | 0.037 |
| 3 | India | .in | 22,565,110 | 48.8% | 1,450.0M | 0.016 |
| 4 | Taiwan | .tw | 6,586,565 | 67.3% | 23.4M | 0.28 |
| 5 | Iran | .ir | 6,491,907 | 40.1% | 89.0M | 0.073 |
| 6 | Indonesia | .id | 6,362,319 | 45.3% | 281.0M | 0.023 |
| 7 | South Korea | .kr | 3,414,307 | 66.5% | 51.7M | 0.066 |
| 8 | Thailand | .th | 3,192,518 | 91.7% | 71.7M | 0.045 |
Japan is Asia's domain powerhouse — and the only large Asian country that resolves at European density. At 73.4 million hostnames and 76.7% A-resolution, .jp matches Germany's liveness and outweighs the next-largest Asian ccTLD by 21 million. This is consistent with Japan's early internet adoption (JUNET, 1984) and a .jp namespace commercially active since the 1990s — Japan went online during the open-web era, much like Western Europe.
Germany alone holds more hostnames than China, India, and Indonesia combined. .de's 117.7 million exceeds the 81.1 million from those three Asian giants — a combined population of roughly 3.1 billion. The reasons differ by country and are structural rather than a simple matter of access: China's .cn resolves at only 49.0%, consistent with a parallel platform ecosystem (super-apps and licensed hosting) where much internet participation never touches the open ccTLD web; India's .in resolves at 48.8% and sits at 0.016 hostnames per capita, consistent with an English-dominant, export-oriented tech sector that defaults to global .com rather than .in.
Thailand's .th resolves at 91.7% — the highest live share of any sizeable ccTLD on the continent — even as its raw count (3.2 million) is modest. This is the inverse of the China/India pattern: a small but almost-entirely-maintained namespace. It underlines why resolution belongs alongside raw counts: a 3.2-million namespace that is 92% live is a different object from a 52-million namespace that is 49% live.
The Americas: Brazil's Quiet Dominance
The Americas hold 143 million ccTLD hostnames — 14.7% of the mapped total — sharply concentrated in a few countries.
Americas ccTLD Hostnames (Top 7)
| Rank | Country | ccTLD | Hostnames | A-Resolution | Population | Hostnames per Capita |
|---|---|---|---|---|---|---|
| 1 | Brazil | .br | 50,303,337 | 60.6% | 212.0M | 0.24 |
| 2 | Canada | .ca | 22,067,608 | 68.4% | 40.0M | 0.55 |
| 3 | Colombia | .co | 20,764,558 | 48.2% | 52.0M | 0.40 |
| 4 | United States | .us | 13,690,456 | 43.0% | 335.0M | 0.041 |
| 5 | Argentina | .ar | 9,936,070 | 52.6% | 46.0M | 0.22 |
| 6 | Mexico | .mx | 8,241,838 | 56.9% | 130.0M | 0.063 |
| 7 | Chile | .cl | 6,371,539 | 56.4% | 19.5M | 0.33 |
Brazil's .br leads the Americas at 50.3 million hostnames — the fourth-largest ccTLD in the world — with a healthy 60.6% resolution rate, consistent with a mature domestic web. Canada's .ca is now the continent's clear #2 at 22.1 million (the previous edition placed Colombia second; the recount and reclassification move Canada ahead). With 68.4% resolution, .ca is the best-maintained large namespace in the Americas.
Colombia's .co should be read with caution, and our Methodology flags it. At 20.8 million hostnames it ranks third, but .co has been marketed worldwide since 2010 as a short .com alternative, so a meaningful fraction of those names are not Colombian at all — and its 48.2% resolution rate, well below Brazil's and Canada's, is consistent with a large promotional tail. The number tells us more about global marketing than Colombian adoption; we do not treat .co as a clean national-usage signal.
The United States' .us is a paradox: the world's largest internet economy maintains one of its smaller ccTLDs. At 13.7 million hostnames — behind Brazil, Canada, and Colombia — and only 43.0% resolution (the lowest of the seven), .us reflects the fact that American entities defaulted to .com from the start. With over 1.36 billion .com hostnames in the dataset, the US already owns the world's default namespace and never needed .us.
Africa: The Continent the Raw Number Hides
Africa is where careless counting produces the most wrong conclusions. The raw total — 46.3 million hostnames, 4.8% of mapped ccTLDs — looks like real growth over the previous edition's 16 million. It is not. It is almost entirely Freenom free-domain inventory that does not resolve.
African ccTLD Hostnames: Raw vs. Resolving
| Country | ccTLD | Hostnames | A-Resolution | Live Hostnames | Class |
|---|---|---|---|---|---|
| South Africa | .za | 14,990,761 | 61.0% | 9,149,825 | Genuine national |
| Gabon | .ga | 5,893,889 | 1.4% | 80,042 | Freenom free-domain |
| Mali | .ml | 5,889,840 | 1.7% | 101,530 | Freenom free-domain |
| Central African Rep. | .cf | 5,181,303 | 2.1% | 109,276 | Freenom free-domain |
| Equatorial Guinea | .gq | 4,489,383 | 1.7% | 75,753 | Freenom free-domain |
| Nigeria | .ng | 2,076,855 | 31.4% | 652,706 | Genuine national |
| Kenya | .ke | 1,499,630 | 43.0% | 645,239 | Genuine national |
| Morocco | .ma | 1,110,252 | 58.2% | 646,620 | Genuine national |
The four African Freenom ccTLDs hold 21.5 million hostnames between them — and just 366,601 of those resolve. A combined resolution rate of 1.7% is not a national namespace; it is dead inventory. Gabon (population ~2.4 million) does not have 5.9 million domains in genuine use any more than Tokelau (population ~1,500) has 7.2 million. These strings were given away free worldwide, filled with throwaway and abusive registrations, and largely abandoned. Counting them as African internet adoption inflates the continent's total by 46% and tells you nothing true.
Strip the Freenom strings and real African usage is roughly 24.8 million hostnames — and South Africa's .za is 60% of it. .za alone holds 15.0 million hostnames at 61.0% resolution, a genuinely maintained namespace consistent with early .za delegation (1990) and a commercial web culture that matured alongside Europe's. Remove South Africa and the rest of the continent's real namespace is under 10 million hostnames — fewer than Hungary's .hu (11.4 million). The African digital divide is real, but it is sharper and more concentrated than the raw 4.8% suggests, not less.
Nigeria, Africa's largest economy with ~230 million people, has 2.1 million ccTLD hostnames resolving at 31.4% — the lowest live share of the genuine African namespaces in our table. This is consistent with a mobile-first, platform-centric internet: where WhatsApp, Facebook, and Instagram are the internet for most users, a national domain is not part of the path online. The pattern is structural, and it is the opposite of the open-web trajectory that built Europe's namespace.
Oceania: One Real Country, One Free-Domain Mirage
Oceania's 52.3 million hostnames look impressive per capita, but the figure is the product of one genuine namespace and one Freenom string.
Oceania ccTLD Hostnames
| Country | ccTLD | Hostnames | A-Resolution | Population | Class |
|---|---|---|---|---|---|
| Australia | .au | 32,189,304 | 67.7% | 26.6M | Genuine national |
| Tokelau | .tk | 7,178,636 | 2.5% | ~1,500 | Freenom free-domain |
| New Zealand | .nz | 5,950,043 | 62.0% | 5.1M | Genuine national |
| Tuvalu | .tv | 2,301,158 | 57.8% | ~11,000 | Repurposed-global |
| Palau | .pw | 1,214,005 | 19.8% | ~18,000 | Repurposed/abuse-heavy |
Australia and New Zealand register at rates that match most of Europe — and resolve like it. .au's 32.2 million at 67.7% resolution rivals Belgium and the Czech Republic; .nz at 62.0% sits with the European mid-tier. Both went online early, have high broadband penetration and strong English-language web cultures, and operate mature registries. In domain behavior, Australia and New Zealand are a detached piece of Europe — high density, high resolution, modest total volume.
Everything else in Oceania is a labeling artifact. Tokelau's .tk (7.2 million hostnames, population ~1,500, 2.5% resolution) is the largest single Freenom string and should never be read as Tokelauan usage; .tv (Tuvalu) is sold worldwide as a "television" string; .pw (Palau) is a repurposed string with a heavy abuse history and 19.8% resolution. Excluding the free-domain and repurposed strings, real Oceania is Australia plus New Zealand — about 38 million hostnames, 84% of it Australian.
The Three Internets: A Structural Reading
The data is consistent with not one digital divide but three distinct relationships between population, internet access, and durable namespace. We present these as descriptive models, not causal laws — each is an inference from the count-and-resolution pattern, not a proof.
Internet Model Comparison
| Model | Representative | ccTLD Hostnames | A-Resolution | Reading |
|---|---|---|---|---|
| Open Web | Germany (.de) | 117.7M | 75.2% | Large, maintained national namespace |
| Platform-First | China (.cn) | 52.2M | 49.0% | Big count, large inactive tail; usage on super-apps |
| Mobile-Social | Nigeria (.ng) | 2.1M | 31.4% | Small namespace, lowest live share |
The Open Web model shows up as a large and live namespace. Germany, the Netherlands, Italy, and Japan combine high hostname counts with 70%+ resolution — the namespace is not just registered but maintained. This is consistent with countries that went online when the browser was the primary interface and a domain was synonymous with having a presence.
The Platform-First model shows up as a big count with a soft middle. China's 52 million .cn hostnames resolve at only 49% — consistent with an ecosystem where much internet activity happens inside licensed platforms and super-apps rather than on independently-hosted ccTLD sites. The namespace exists on paper more than it answers in DNS.
The Mobile-Social model shows up as a small namespace with the lowest resolution. Nigeria's .ng (31.4% live) and the African Freenom strings (under 2%) sit at the bottom on both axes. Where internet access arrived via smartphones and was immediately captured by social platforms, the "register a domain and build a site" phase that defined European adoption was largely skipped. The resolution data is the clearest evidence: these namespaces are not just small, they are thinly maintained.
What's at Stake
The geographic distribution of resolving ccTLD namespace reveals structural inequalities that internet-access statistics alone cannot capture:
- Europe holds 51% of mapped ccTLD hostnames with roughly a tenth of the world's population — a five-fold over-representation reflecting decades of open-web culture, cheap registration, and mass-market registries. Asia holds 21% with 60% of the population.
- Germany alone (117.7 million hostnames, 75.2% live) outweighs China, India, and Indonesia combined (81 million) and the entire raw African total (46 million). These are order-of-magnitude gaps, and Germany's namespace is also far more live than any of the larger-population comparators.
- Nearly half of Africa's raw ccTLD total is Freenom free-domain churn that resolves at under 2%. The genuine African namespace is roughly 25 million hostnames, 60% of it South African — sharper and more concentrated than the headline 4.8% implies. Counting dead inventory as adoption obscures exactly where investment is needed.
- Resolution sorts the world as cleanly as raw counts do. Open-web ccTLDs (.de, .jp, .it, .nl) resolve at 70–81%; the African Freenom strings resolve at 1–3%. A count that ignores resolution overstates the namespaces that are least real.
- The US maintains one of its smaller ccTLDs (.us, 13.7M, 43% live) despite the world's largest internet economy — because .com obviated .us. America is the only major economy whose digital identity is not tied to its country code.
What Would Help
1. Researchers and journalists: never cite a raw ccTLD total without a resolution check. The 46-million African figure is technically correct and analytically worthless; the ~25-million ex-Freenom figure, with .za at 60%, is the one that means something. Our country statistics page and the dataset expose both counts and resolution so the difference is auditable.
2. African registries: reduce cost and verification friction for genuine namespaces, and retire the free-domain model. The Freenom experiment shows that free registration fills a namespace without building one — under 2% of it resolves. South Africa's .za (15 million, 61% live) shows what a maintained African ccTLD looks like. Lowering price and simplifying verification on real national registries is more useful than zero-cost giveaways that attract abuse.
3. Development organizations: treat resolving namespace, not registration count, as the production metric. Access metrics measure consumption; a maintained, resolving national namespace is a rough proxy for the capacity to publish and host on the open web. Mobile-social adoption lets citizens consume but leaves the infrastructure — and the value — with platform owners abroad. Compare countries on our country statistics page.
4. ICANN: publish ccTLD data broken out by registrant geography and by free-vs-paid registration. The .co marketing inflation and the Freenom free-domain distortion are the same problem in two forms: territory-of-delegation tells you nothing about who actually registered or whether the name resolves. Geographic and free/paid attribution would let analysts separate national adoption from global repurposing and from giveaway churn.
5. Anyone making claims about "global internet access": specify access to what, and how much of it resolves. Billions are online, but "online" means different things in Germany (118 million live-leaning ccTLD hostnames, anyone can publish) and in the Freenom territories (millions of registrations, almost nothing that answers). The internet is not one thing; the count-and-resolution data shows at least three models, with very different implications for who controls the infrastructure.
This analysis is based on the DomainsProject dataset, which continuously indexes hostnames across the active TLDs in the IANA root zone (Russian-administered TLDs excluded). Counts reflect the June 2026 snapshot (971,436,501 ccTLD observed hostnames across the country-code namespace, of which 939,368,820 map to a continent); resolution figures reflect our 9 June 2026 A-record crawl (whole-namespace rate 58.9%). ccTLDs are mapped to the continent of their delegated territory; repurposed-global strings (.io, .cc, and others) and Freenom free-domain strings (.tk, .ga, .ml, .cf, .gq) are flagged and discounted as described in the Methodology. Generic-TLD hostnames (.com, .net, .org, etc.) are not attributed to countries and are excluded. Population figures are UN 2025 estimates; per-capita ratios are relative indicators, not precise density measures. Explore the full data on our country statistics page and TLD statistics dashboard, or download the complete dataset.